
NL Journal of Agriculture and Biotechnology
(ISSN: 3048-9679)
Investigation of the Mechanochemical Synthesis of Iron (III) Oxide Nanoparticles as a Potential Treatment Technology for Pharmaceutical Wastewater Discharge
Author(s) : Patrick Enuneku Omuku, Wisdom Michael Sambo, Gloria Nwanisobi, Obianeli Chinelo Scholastica, Mary Jane Chioma Ezechukwu. DOI : 10.71168/NAB.02.03.114
Abstract
The synthesis, characterization and analysis of Fe2O3 nanoparticles and their efficiency in treating pharmaceutical wastewater were investigated. The Fe2O3 nanoparticles, produced through mechanochemical synthesis, had a rough surface texture with numerous small depressions and protrusions, increasing their adsorption capacity. EDX analysis identified 12 elements, with carbon and iron being the most prominent at 33. 83% and 25.74%, respectively. The particles varied in size from approximately 50 nm to 200 nm and displayed mostly spherical shapes, with some agglomeration that contributed to high surface area and attractive forces. FTIR Analysis identified various functional groups such as aldehydes, carboxylic acids, alkynes, benzene structures, amines, and alcohols groups. The Fe2O3 nanoparticles showed a high efficiency in decontaminating PAHs, with observed efficiency trend: Dibenzo(a,h) anthracene (99.60%) > Anthracene (99.12%) > Benzo(g,h,i) perylene (98.78%) > Pyrene (98.68%) > Phenanthrene (98.66%) > Acenaphthene (98.53%) > Fluoranthene (97.52%) > Benzo(a)pyrene (97.01%) > Acenaphthylene (94.92%) > Fluorene (90.69%) > Chrysene (84.96%) > Indeno (1,2,3)pyrene (82.56%) > Benzo(a)anthracene (73.22%) > Benzo(b)fluoranthene (64.66%) > Benzo(b) anthracene (39.84%) > Benzo(k)fluoranthene (31.80%). The untreated and treated wastewater recorded values of 426 mg/l and 108 mg/l respectively for COD, with a percentage removal efficiency of 75%. The trend in the percentage removal efficiencies of the Fe2O3 nanoparticles was Sulphates (96%), Cl (92%), COD (75%), DO (67%), and BOD (47%). However, there was an increase in nitrate levels after treatment, suggesting that Fe2O3 nanoparticle may not be suitable for treating pharmaceutical wastewater with high levels of Nitrates ions. The nanoparticle showed high capacity for treating pharmaceutical wastewater with high levels metals. The removal efficiency of Cu concentrations was 51%, while Ni recorded the least removal efficiency. The strength of the removal efficiency for the Fe2O3 nanoparticle was Cu > Zn > Cr > Pb > Ni. Initial characterization showed significant bacterial colonies, total bacterial count, and E. coli, which were greatly reduced after treatment with Fe2O3 nanoparticles. No evidence of coliform growth indicated no faecal contamination in the effluent. The research highlights the effectiveness of Fe2O3 nanoparticles in treating pharmaceutical wastewater by significantly reducing various contaminants and improving the quality of the effluent. Keywords: Mechanochemical, synthesis, porous, nanoparticle, contaminants, wastewater.
Introduction
Pharmaceutical wastewater discharge is a complex mixture of pollutants, such as APIs, solvents, and other chemicals, which pose ecological and health risks when released into the environment [1-2].
Traditional treatment technologies are often ineffective and costly, highlighting the need for innovative approaches. Mechanochemical synthesis of iron (III) oxide nanoparticles has emerged as a promising approach for wastewater treatment [3-4]. This process offers simplicity, cost-effectiveness, and environmental sustainability compared to traditional methods. Iron (III) nanoparticles have been extensively studied for their potential to remove pollutants, including heavy metals and organic compounds [4], in wastewater treatment. However, little research has been conducted on their mechanochemical synthesis and their effectiveness in removing specific pharmaceutical pollutants. Pharmaceutical items must be consumed for a number of reasons. These variables include changes in the population’s demographics, epidemiology, and lifestyle, such as an aging population, a rise in chronic illnesses [5-7], the accessibility of a large number of over-the-counter medications at low cost, and the availability of affordable generic medicines [8.10]. This high demand has made countries promote industrialization and focus on the production of this drugs to deal with this problem. By doing so, they end up polluting the air, water, soil, and food items, thus affecting human health. It causes water contamination through discharge of volatile organic compounds and other pollutants during finishing of products, and paperboard formation [9-10]. The pharmaceutical industry produces drugs which are helpful in saving life but their activity ultimately leads to environmental pollution. Pharmaceutical wastes were generated as long as these products were produced day by day [11-13].
In addition, the stability and toxicity of iron (III) oxide nanoparticles in various wastewater matrices are not well understood, particularly in the context of pharmaceutical wastewater treatment [14-16]. This study aims to investigate the potential of mechanochemical synthesis of iron (III) oxide nanoparticles as a treatment technology for pharmaceutical wastewater discharge, including their effectiveness in removing specific pharmaceutical pollutants and their stability and toxicity in various wastewater matrices [17].
Materials and Methods
Mechanochemical Synthesis of Iron (III) Oxide: 2g of iron powder and 1g of iron (III) chloride hexahydrate was weighed into mechanical blender bowl and 10 mL of deionized water and 1M sodium hydroxide solution (1:1) was added to the bowl. The grinding bowl was loaded into the planetary ball mill. The mixture was grinded at 200-300 rpm for 2hrs. The mill was stopped and washed with deionized water. The nanoparticles were separated from the grinding medium by centrifugation at 10000 rpm for 10 minutes. They were washed with deionized water and ethanol and dried in a vacuum oven at 60oC for 2 hours.
Sample collection: The wastewater samples were collected from five different pharmaceutical companies in Awka Anambra state and were labeled A-E. The sample samples were mixed thoroughly to obtain a composite sample for the analysis.
Determination of pH: pH was measured in situ by Electrometric Method using Laboratory pH Meter Hanna model HI991300 (APHA; 2005). Electrical conductivity analysis was carried out accordingly via APHA 2510 B guideline Model DDS-307 (APHA; 1998). The turbidity of the sample was carried out by pouring 50 mL of the sample into a clean, dry turbidity vial and cap securely. Excess liquid was wiped off with a soft cloth and placed into the AQ4500 sample chamber and covered with vial cap. The turbidity of the original sample was then computed from the turbidity of the diluted sample where the dilution factor was calculated according to equation: Nephelometric Turbidity units (NTU) = AXB ; (A = NTU found in diluted sample, B = Volume of dilution water. C = Sample volume taken for dilution, ml interpretation of results). Total dissolved solid (TDS) was determined using APHA 2510 A TDS 139 tester (APHA; 1998). The total solids (TS) was the term applied to the material residue left in the vessel after evaporation of the water sample and its subsequent drying in an oven at a temperature of 103- 105oC. Total solids include Total Suspended Solids and Total Dissolved Solids (APHA; 1998). 100ml of the water samples (50ml) was measured into a pre-weighed dish and evaporated to dryness at 103oC on a steam bath. The evaporated sample was dried in an oven for about an hour at 103-105oC, cooled in a desiccator and recorded for constant weight. Total suspended solid (TSS) was determined by subtracting the result of total dissolved solids from total solid. Total solids (TS) – Total dissolved solids (TDS) = Total Suspended solids (TSS) (APHA; 1998). Nitrate (NO-3) was determined using PD303 UV Spectrophotometer (APHA; 1998). Phosphate, Chlorides and sulphates were analyzed according to APHA standard method (APHA; 1998). The BOD, COD and DO were measured using standard analytical method of APHA. (American Public Health Association, 1998).
Methods for the elemental metal analysis: Metal analysis was conducted using Varian AA240 Atomic Absorption Spectrophotometer according to the method of APHA 1995 (American Public Health Association).
Chromatographic analyses (PAH, VOC): The chromatographic analyses were carried out using a Buck scientific M910 gas chromatograph, equipped with on-column injector, technique of simple on-column injection and flame ionization detector. An SGE HT-5 capillary column (25 m × 0.32 mm i.d., 0.1 µm film thickness) was used for the GC separation (Ringwood, VIC, Australia). Injection volume of 1 µL, hydrogen as carrier gas with linear velocity of 50 cm sec-1 and flame ionization detector at 380ºC were used. The column oven temperature program was 50ºC (1 min hold), 15ºC min-1 up to 180ºC, 7ºC min-1 up to 230ºC; 30ºC min-1 up to 380ºC (15 min hold); on-column injector with direct injection mode and temperature at 70ºC (1 min hold), 20 ºC min-1 up to 380ºC (10.31 min hold).
Characterization of nanoparticles: The surface morphology of synthesized Fe2O3 was studied by field emission scanning electron microscopy (FESEM). In order to identify the characteristic functional group present on the surface of the Fe2O3, Fourier transform infrared (FTIR) spectra of all samples were recorded by using Buck scientific M530 USA FTIR, in a range of 600–4000 cm−1. Elemental analysis was performed by energy dispersive SEM (EDX) spectroscopy.
FTIR Analysis: Buck scientific M530 USA FTIR was used for the analysis. This instrument was equipped with a detector of denatured triglycine sulphate and beam splitter of potassium bromide. The software of the Gram A1 was used to obtain the spectra and to manipulate them. An approximate of 1.0g of samples, 0.5ml of nujol were added, they were mixed properly and placed on a salt pellet. During measurement, FTIR spectra was obtained at frequency regions of 4000- 600 cm-1 and co-added at 32 scans and at 4cm-1 resolution. FTIR spectra were displayed as transmitter values.
Microbial analysis: Sugar Fermentation Test: Each of the isolate was tested for its ability to ferment a specific sugar. 1g of the sugar and 1g of peptone water were dissolved in 100ml of water. 5ml of the solution were transferred into clean test-tubes using sterile pipettes. The test-tubes containing peptone water and sugar were added Durham’s tube which were placed inversely and bromothymol blue as an indicator. These were sterilized for 10 minutes and allowed to cool before inoculating the inocula. The test-tubes were incubated for 3days. The production of acid and gas or acid only indicated utilization of sugars. Acid production was indicated by change in colour of the medium from green to yellow while gas production was observed by presence of gas in the Durham’s tubes. Characterization of fungal isolates:
This was done based on the description of the gross morphological appearance of fungal colonies on the SDA culture medium and the slide culture technique for microscopic evaluation with reference to the Manual of Fungal Atlases [19-20].
Results and Discussion
The Scanning Electron Microscope and Energy Dispersive X-ray (SEM-EDX) analysis results are presented on Image 1 and Table 1. The morphological characteristics, size distribution, agglomeration and elemental composition of Fe2O3 nanoparticles produced from mechanochemical synthesis were analyzed using Scanning electron microscope with Energy-Dispersive X-ray.
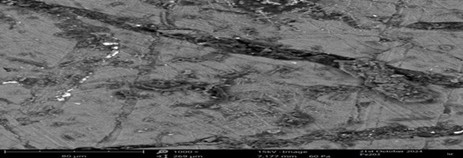
Image 1: SEM-EDX Analysis of Fe2O3 Nanoparticles
Different porous structures with many linked pores of different sizes were visible in the SEM image. A lot of surface area was available for the adsorption of different compounds in these holes. From relatively large particles to smaller, more granular ones, the image showed a wide variety of particle sizes. The mechanochemically synthesized Fe2O3 nanoparticles’ surface had a textured, uneven appearance with plenty of tiny depressions and protrusions, because there was more surface area available for interaction with adsorbates, this roughness can increase the adsorption capacity.
| Element Number | Element Symbol | Element Name | Atomic Conc. | Weight Conc. (%) |
| 6 | C | Carbon | 36.64 | 33.83 |
| 7 | N | Nitrogen | 8.82 | 7.73 |
| 12 | Mg | Magnesium | 7.32 | 11.96 |
| 17 | Cl | Chlorine | 1.99 | 4.75 |
| 19 | K | Potassium | 1.72 | 4.53 |
| 14 | Si | Silicon | 1.01 | 1.90 |
| 11 | Na | Sodium | 1.15 | 1.78 |
| 20 | Ca | Calcium | 0.43 | 1.16 |
| 15 | P | Phosphorus | 0.47 | 0.97 |
| 26 | Fe | Iron | 35.20 | 25.74 |
| 22 | Ti | Titanium | 2.10 | 2.33 |
| 16 | S | Sulfur | 3.15 | 3.32 |
Table 1: Elemental Composition of the Mechanochemically Synthesized Iron (III) Oxide Nanomaterial
The elemental composition of the mechanochemically synthesized Iron (III) Oxide from the SEM-EDX analysis revealed presence of 12 elements with observed trend in atomic number as C > Fe > N > Mg > S > Ti >Cl > P > Na > Si > P > Ca. The most prominent element were carbon and Iron with weight concentrations of 33.83% and 25.74% respectively. Besides high weight concentration of carbon and iron, appreciable amount of N (8.82%) and Mg (7.32%) were also observed with least Ca concentration of 0.43%. The variations in the atomic and weight concentration of the elements in the Fe2O3 was represented in Figure 1.
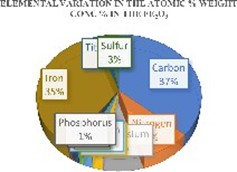
Figure 1: Variation in the Atomic & Weight % concentration of the Fe2O3.
The SEM analysis, revealed that the particles have a broad size distribution, ranging from approximately 50nm to 200nm. The particles exhibited a spherical or near spherical morphology with some degree of agglomeration forming clusters which is responsible for its high surface area and attractive forces. These key features suggest that the nanoparticles were synthesized using solution-based method such as mechanochemical synthesis. The EDX result showed the elemental composition of the nanoparticles. It was identified that higher concentration of carbon (33.83 %) was observed, followed by iron (25.74%) and magnesium (11.94 %). All other elements were in minute weight concentrations.
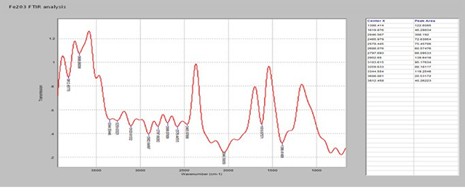
Figure 2: FTIR analysis of the synthesized Fe2O3 nanoparticles.
| Peak | Peak Intensity | Peak Shape | Bond | Compound |
| 1388.414 | Strong | Sharp | C-H stretching | Aldehyde |
| 1619.876 | Strong | Very sharp | C=O stretching | δ-lactam |
| 2046.567 | Strong | Sharp | N=C=S stretching | Isothiocyanate |
| 2465.879 | Strong | Sharp | C=C stretching | Terminal alkyne |
| 2578.445 | Medium | Sharp | O-H stretching | Carboxylic acid |
| 2688.076 | Medium | Sharp | C-H stretching | Aldehyde |
| 2797.693 | Medium | Sharp | N-H stretching | Amine salt |
| 2902.65 | Medium | Sharp | C-H stretching | Alkane |
| 3103.615 | Medium | Sharp | C-H stretching | Alkene |
| 3259.633 | Medium | Broad | C-H stretching | Alkynes |
| 3344.554 | Medium | Broad | N-H stretching | Aliphatic primary amine |
| 3688.061 | Medium | Sharp | O-H stretching | Alcohol |
| 3812.458 | Medium | Sharp | O-H stretching | Free alcohol |
Table 2: FTIR analysis of the synthesized Fe2O3 nanoparticles.
Fourier Transform Infra-Red analysis was conducted to assess the functional group present in the synthesized Fe2O3 (Fig 2). Table 2 showed the functional group present in Fe2O3. The various peak ranged from 1388cm-1 to 3812cm-1 were assigned to the various functional groups (aldehyde, carboxylic acid, alkynes, amines, alcohols, etc) as shown on Table 2.
| Parameters | Un Treated | Treated | % Removal |
| Turbidity (NTU) | 44.667 ± 2.517 | 8.333 ± 0.577 | 18.6558 |
| pH | 5.590 ± 0.069 | 6.423 ± 0.012 | -12.97 |
| TDS (mg/L) | 122.000 ± 0.000 | 27.667 ± 0.577 | 22.1311 |
| Conductivity (µs/cm) | 556.333 ± 96.500 | 85.667 ± 3.453 | 15.3985 |
| Chloride (mg/L) | 180.367 ± 10.103 | 14.033 ± 0.058 | 7.7802 |
| DO (mg/L) | 43.333 ± 6.506 | 13.667 ± 1.528 | 31.5395 |
| BOD (mg/L) | 60.333 ± 1.528 | 31.667 ± 2.309 | 52.4870 |
| Sulphate (mg/L) | 72.421 ± 0.447 | 22.273 ± 0.540 | 30.7549 |
| Phosphate (mg/L) | 26.291 ± 0.392 | 17.407 ± 0.835 | 66.2090 |
| Nitrate (mg/L) | 9.356 ± 0.714 | 15.141 ± 3.043 | -38.21 |
| TSS (mg/L) | 1.478 ± 0.045 | 0.382 ± 0.019 | 25.8457 |
| COD (mg/L) | 426.667 ± 48.881 | 108.000 ± 7.937 | 25.3125 |
| Phenol (mg/L) | 1.726 ± 0.025 | 0.371 ± 0.029 | 21.4948 |
Values are mean ± standard deviation of triplicate readings: P<0.05, Dissolve oxygen (DO), Biological Oxygen Demand (BOD), Total soluble solid (TSS), Chemical Oxygen Demand (COD)
Table 3: Physiochemical Analysis of the Pharmaceutical Wastewater effluent
The physiochemical result as shown on Table 3 indicated different concentrations of the physiochemical parameters of the untreated and treated water effluents from pharmaceutical companies. It was observed generally that the physiochemical parameters of the untreated water sample reduced when treated with iron (III) oxide nanoparticles except for pH values which increased by 12.97% and nitrate concentration increased by 38.21%. The turbidity of the untreated water sample reduced by 18.6558 % when treated with iron (III) Oxide. The electrical conductivity of the untreated sample decreased by 15.3985%, chloride was removed by 7.7802%, dissolve oxygen decreased by 31.5395 %, biological oxygen demand from decreased by 53.4870%. The concentration of chemical oxygen demand decreased by 25.3132%, phosphate concentration for the untreated sample 66.2029%. The concentration of sulphate in the untreated sample decreased by 66.3920%. Phenol decreased by 21.4948%, TSS concentration decreased by 25.3125 % and total dissolve solid in the untreated sample decreased by 22.1311%. The pharmaceutical wastewater turbidity of 44.66 NTU was higher than the amount 10.37 NTU reported by Omuku et al 2024 for fastfood wastewater, but after treatment it reduced to 8.33 NTU, a value lower than the published value of 10.37 NTU by Omuku et al, 2024, but higher than the amount 5.68 NTU recorded for wastewater effluent from beverage company by Osho et al, 2010.
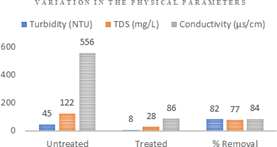
Figure 3: Variation in the % Removal Efficiency for the Physical Parameters.
The high value of electrical conductivity (556 µs/cm) before treatment was reduced to 86 µs/cm after treatment with the mechanochemically synthesized Fe2O3 nanoparticle which recorded a significant 84% removal efficiency. The TDS value of 122 mg/L observed in the untreated pharmaceutical wastewater had a reduction value of 28 mg/L revealing percentage removal efficiency of 77% after treatment with the Fe2O3 nanoparticle. The untreated pharmaceutical wastewater recorded 45 NTU while this turbidity was reduced to 8 NTU with percentage removal efficiency of 82% (Figure 3).
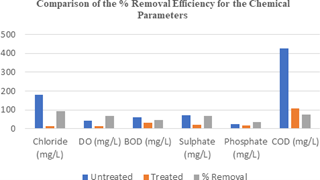
Figure 3: Variation in the % Removal Efficiency for the Chemical Parameters.
Significant reductions in the values of some chemical parameters were recorded after the pharmaceutical waste- water were subjected to decontamination using mechanochemically synthesized Fe2O3 nanoparticle. The un- treated and treated wastewater recorded values of 426 mg/l and 108 mg/l respectively for COD, with percentage removal efficiency of 75%. The observed trend in the percentage removal efficiencies of the Fe2O3 nanoparticles was Sulphates (96%) > Cl (92%) > COD (75%) > DO (67%) > BOD (47%). It was also observed that there was appreciable increase in the nitrates level after treatment as the concentration of nitrate increased from 9.36 mg/l for the untreated to 15.14 mg/l for the treated wastewater, indicative that Fe2O3 nanoparticle may not be good for the treatment of pharmaceutical wastewater with high levels of Nitrates ions.
| Parameters | Un Treated | Treated | % Removal |
| Cd | 0.003 ± 0.002 | 0.000 ± 0.000 | 100 |
| Cr | 0.623 ± 0.106 | 0.211 ± 0.014 | 33.94 |
| Cu | 1.396 ± 0.093 | 0.724 ± 0.096 | 51.85 |
| Pb | 0.093 ± 0.019 | 0.0178 ± 0.003 | 19.13 |
| Hg | 0.000 ± 0.000 | 0.000 ± 0.000 | nil |
| Zn | 0.779 ± 0.053 | 0.329 ± 0.017 | 42.21 |
| Ni | 0.242 ± 0.056 | 0.016 ± 0.003 | 6.61 |
| As | 0.002 ± 0.001 | 0.000 ± 0.000 | 100 |
| Fe | 1.730 ± 0.182 | 4.196 ± 0.042 | 58.77 |
Table 4: Results of Trace and Heavy Metal Analysis of Pharmaceutical Wastewater.
The results of the metal analysis of the pharmaceutical wastewater showed the occurrence of trace metals in higher concentrations relative to the heavy metal concentrations (Table 4). The untreated pharmaceutical wastewater recorded sum of the trace metal (Cu, Zn, Ni, Fe) concentration as 4.147 mg/L with mean concentration of 1.037 mg/L compared to the sum of the concentration of heavy metal (Cd, Pb, As, Hg) of 0.098 mg/L with average value of 0.0245 mg/L.
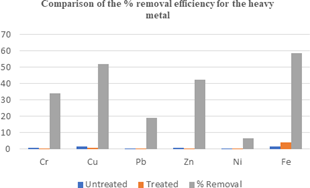
Figure 4: Variation in the % Removal Efficiency for the metals in the Wastewaters.
The Fe2O3 nanoparticle showed a high capacity for the treatment of pharmaceutical wastewater with high levels of both trace metals (Cu, Zn,) and heavy metals (Cr, Pb). Cu concentrations in both untreated and treated pharmaceutical wastewater were 1.396 mg/L and 0.724 mg/l respectively with 51% removal efficiency. Ni recorded the least removal efficiency of 7% as the concentration decreased from 0.242 mg/l to 0.016 mg/l respectively for untreated and treaded pharmaceutical wastewater. The trend in the strength of the Fe2O3 nanoparticle observed for the removal of the metals was Cu > Zn > Cr > Pb > Ni. The Fe2O3 nanoparticle did not show any ability to be used as treatment agency for the pharmaceutical wastewater contaminated with iron as a noticeable increase in the concentration of iron in the untreated pharmaceutical wastewater (1.73 mg/L) to 4.20 mg/l in the treated wastewater was observed (58% increase after treatment).
Comparative Study of the Physiochemical Parameter of the Pharmaceutical Wastewater with standards.
The physiochemical analyses of the pharmaceutical wastewater samples were compared with international and national standards to ascertain the level of pollution caused by the discharged pharmaceutical effluent to the environment.
| Parameter | Un Treated | Treated | Permissible limit by CPCB (mg/L) | EPA standard (2002) | SON |
| Turbidity NTU | 44.667 | 8.333 | - | - | - |
| pH | 5.590 | 6.423 | 5.5-9.0 | 5 – 9 | 6.5-8.5 |
| TDS (mg/l) | 122.000 | 27.000 | 2100 | - | - |
| Conductivity | 556.333 | 85.667 | - | - | - |
| Chloride (mg/l) | 180.367 | 14.033 | 1.000 | 750 | 350 |
| DO (mg/l) | 43.333 | 13.667 | - | 4 | 4.0 |
| BOD (mg/l) | 60.333 | 31.667 | 30.00 | 40 | 6.0 |
| Sulphate (mg/l) | 72.421 | 22.273 | 2.0 | 750 | 500 |
| Phosphate (mg/l) | 26.291 | 17.407 | 10 | 10 | 3.5 |
| Nitrate (mg/l) | 9.356 | 15.141 | 10 | 10 | 40 |
| TSS (mg/l) | 1.478 | 0.382 | <100 | 45 | 0.75 |
| COD (mg/l) | 426.667 | 108.000 | 250 | 120 | 30 |
| Phenol (mg/l) | 1.726 | 0.371 | 1.0 | 0.5 | 0.25 |
CPCB: Center pollution control board standard for discharge of environmental pollutant. EPA: Environmental protection agency standard for effluent discharge regulations. SON: Standard Organization of Nigeria.
Table 5: Comparison of Physiochemical Parameters with Standard Regulations
The physiochemical parameters of the pharmaceutical wastewater were compared with the standards. It was noted that the pH, Chloride, TDS and Sulphate of untreated and treated wastewater effluent were within the acceptable limit of CPCB, EPA, and SON. Chloride was above the CPCB standard but lower than EPA and SON standard. The dissolved oxygen concentrations were higher than the standard by CPCB (1.000 mg/L, EPA (750 mg/L) and SON (350 mg/L) for both untreated (180.367 mg/L) and treated (14.033 mg/L) samples. The untreated sample had COD (426.667 mg/L) higher than the CPCB standard (250 mg/L). The treated sample showed COD within the CPCB, EPA (120 mg/L) and SON (30 mg/L). The total soluble solid for the treated and untreated sample were below the standard. Phosphate concentration of untreated (26.291 mg/L) and treated (17.401 mg/L) were above the CPCB (10 mg/L), EPA (10 mg/L) and SON standard (3.5 mg/L). The sulphate concentration of the sulphate below EPA and SON standard but higher than CPCB standard. The untreated sample had nitrate concentration lower than the CPCB, EPA and SON standard but the treated sample higher concentration of nitrate quite above the standards.
Comparison of the physiochemical parameters with previous work on pharmaceutical effluents.
The physiochemical parameters pharmaceutical wastewater was compared with previous work on the analysis of pharmaceutical waste water effluents (Table 6).
| Untreated | Ismail and Habib, 2017 | Vanerkar et al., 2013 | Rohit and Ponmurugan 2013 | Rao et al., 2004 | |
| Turbidity | 44.667 | - | - | - | |
| pH | 5.590 | 7.27 | 3.9 | 6.01 | 7.5 |
| TDS | 122. | - | 2564 | 622 | 20000 |
| Conductivity | 556.333 | - | - | 945 | - |
| Chloride | 180.367 | - | - | - | 200 |
| DO | 43.333 | - | - | - | - |
| BOD | 60.333 | 40 | 11,200 | 410 | 7200 |
| Sulphate | 72.421 | 138 | 85 | - | 360 |
| Phosphate | 26.291 | - | 270 | 6.8 | 100 |
| Nitrate | 9.356 | 7.23 | - | - | |
| TSS | 1.478 | 118 | 5460 | 110 | 7500 |
| COD | 426.667 | 810 | 21960 | 548 | 25000 |
| Phenol | 1.726 | 185 | - | - |
Table 6: Comparison with other literature on the analysis of pharmaceutical wastewater effluents.
The results of this study showed that the pH value obtained for the untreated sample was (5.590) which was in agreement with the result obtained by Rohit and Ponmurugan, 2013 (6.01) but slightly lower than the result obtained by Ismail and Habib, 2017, (7.27) and Rao et al., 2004 (7.5). The total dissolve solids for the sample (122 mg/L) were lower than those obtained by Vanerkar et al., 2013 (2564 mg/L), Rohit and Ponmurugan, 2013 (622 mg/L) and Rao et al., 2004 (20000 mg/L). The chloride content was in agreement with that obtained for Rao et al., (2004). The sulphate content obtained for the samples was not in agreement with that reported by Ismail and Habib, 2017, (138 mg/L) and Rao et al., 2004 (360 mg/L). The TSS and phenol content obtained in this analysis was lower than those obtained from other reports (Table 4). The nitrate content obtained for the sample (9.356 mg/L) was in agreement to that obtained by Ismail and Habib, 2017 of 7.23 mg/L.
| No. of Bacterial colonies on plate (cfuml-1) | Total Bacterial Count (cfuml-1) | E. coli (cfuml-1) | |
| Untreated | 12 x 102 | 2.3 x 10⁵ | 15 |
| Treated | 8.0 x 101 | 17.0 x 101 | 4 |
Table 7: Results of Pharmaceutical Wastewater Microbial Analysis (Total coliform Count (cfuml-1).
The initial characterization of the microbial population densities in the untreated water effluent indicated a bacterial colonies of 12 x 102 cfuml-1, total bacterial count of 2.3 x 10⁵ cfuml-1 and E.coli of 15 cfuml-1 but were reduced when treated with Fe2O3 nanoparticles to a lower concentration of 8.0 x 101 cfuml-1 for bacterial colonies on plate, 17.0 x 101 cfuml-1 and 4 cfuml-1 for E. coli. There was no evidence of coliform growth when samples were cultured on MacConkey agar, implying that there was no faecal contamination in the effluent (Table 7).
The contamination factor (CF) for the heavy metals analyzed for the pharmaceutical waste water was computed to measure it level of contaminant in a given environment to its concentration in a reference or background environment.
| Metals (mg/L) | Contamination factor for Untreated effluents | Contamination factor for Treated effluents | ||
| CPCB | WHO | CPCB | WHO | |
| Cd | 0.0015 | 0.3000 | 0.0000 | 0.0000 |
| Cr | 6.2267 | 1.2453 | 2.1133 | 0.4227 |
| Cu | 0.4654 | 139.6333 | 0.2413 | 72.400 |
| Pb | 0.9300 | 0.9300 | 0.1777 | 0.1777 |
| Hg | 0.0000 | 0.0000 | 0.0000 | 0.0000 |
| Zn | 0.1559 | 3.8967 | 0.0658 | 1.6450 |
| Ni | 0.0807 | 2.4200 | 0.0053 | 0.1600 |
| As | 0.0083 | 0.0333 | 0.0000 | 0.0000 |
| Fe | 0.5766 | 17.2967 | 1.3988 | 41.9633 |
CF = metal conc in the sample
background or reference value : CF<1: No contamination, CF =1-3: moderate contamination, CF=3-6: significant contamination CF>6: severe contamination. CF is compared between CPCB standard and WHO standard for discharge of effluents into the environment.
Table 8: Results of the Contamination Factor for the Trace and Heavy Metals of the Pharmaceutical Wastewater
From the results, we noted that there was no contamination by the metals in the untreated pharmaceutical waste- water effluent according to CPCB standard except chromium with a contamination factor of 6.2267 mg/L which indicated severe contamination (Table 8). However, when treated with iron (iii) oxide nanoparticles, it reduced to moderate contamination (2.1133 mg/L). More so, the level of contamination in the water sample increased from no contamination to moderate contamination after treatment (1.3988 mg/L) according to CPCB standard. This was different when compared with WHO standard. There was no contamination by Cadmium, Lead mercury and Arsenic as their contamination factor was less than 1, but moderate contamination of chromium and nickel (CF = 1 - 3) which were reduced when treated using Fe2O3 nanoparticle. Severe contamination by trace metals, copper, iron and zinc (CF > 6) for the untreated waste water effluent was observed but after treatment, the contamination factor for zinc reduced to moderate while copper and iron severely contaminated the water sample.
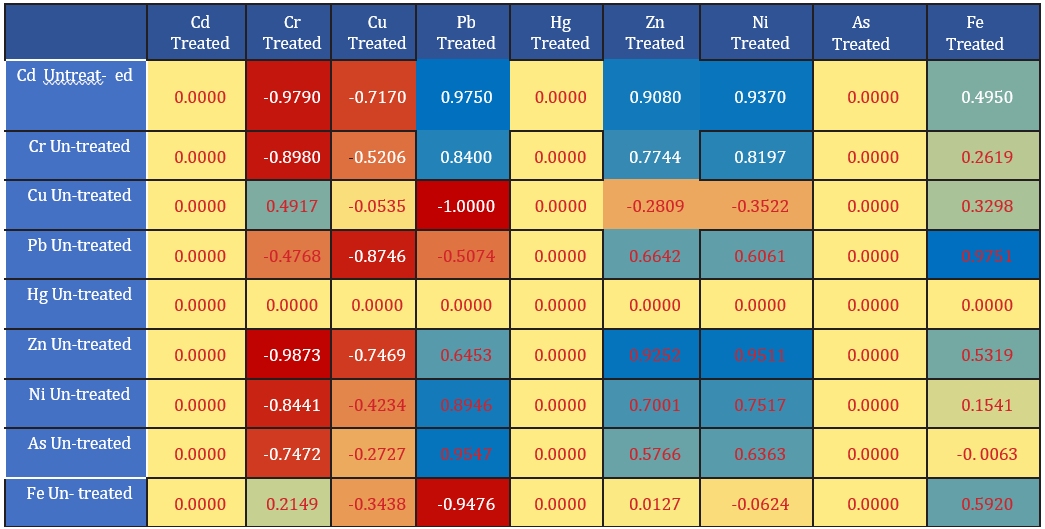
Figure 5: Heat Map for the Correlation of Contamination Factor for Heavy metals in Treated and Untreated Samples.
Pearson correlation was conducted for the contamination factor of metals in the water samples with regards to center of pollution control board (CPCB). All yellow colour represented no correlation between the treated water samples and the untreated water sample. The faint blue to strong blue coloration showed weak positive correlation to strong positive correlation. The faint reddish colour to strong faint coloration showed weak to strong negative correlations between the contamination factor of the treated and the untreated water samples. For instance, the result revealed that there was no correlation (0.000) between cadmium in the treated, mercury and Arsenic with other heavy metals as shown Fig 5 (yellow). The result also showed that there was a strong negative correlation between chromium for treated sample and cadmium of untreated (-0.979), chromium untreated (-0.898) zinc untreated (-0.987), Nickel untreated (-0.8441), and Arsenic untreated (-0.7473), but a weak positive relationship with copper untreated (0.4917). Copper content of the treated wastewater effluent showed strong negative relationship to weak relationship with all the heavy metals of the untreated water samples. Lead concentration in the treated water sample, showed strong positive relationship with cadmium (0.975), chromium (0.84), zinc (0.6453), Nickel (0.8946), and Arsenic (0.9547) but showed negative correlation for copper (-1.00), Lead (-0.5074) and iron (-0.9476) of the untreated water sample.
Geo-Accumulation Index of heavy metals
Geo-Accumulation index (IGEO) was computed to assess the accumulation and pollution levels of metals in wastewater (Table 9).
| Un Treated CPCB | Un Treated WHO | Treated CPCB | Treated WHO | |
| Cd (mg/L) | 0.0003 | 0.0602 | 0.0000 | 0.0000 |
| Cr (mg/L) | 1.2496 | 0.2499 | 0.4241 | 0.0848 |
| Cu (mg/L) | 0.0934 | 28.0225 | 0.0484 | 14.5297 |
| Pb (mg/L) | 0.1866 | 0.1866 | 0.0357 | 0.0357 |
| Hg (mg/L) | 0.0000 | 0.0000 | 0.0000 | 0.0000 |
| Zn (mg/L) | 0.0313 | 0.7820 | 0.0132 | 0.3301 |
| Ni (mg/L) | 0.0162 | 0.4857 | 0.0011 | 0.0321 |
| As (mg/L) | 0.0017 | 0.0067 | 0.0000 | 0.0000 |
| Fe (mg/L) | 0.1157 | 3.4712 | 0.2807 | 8.4215 |
IGEO=log2 Concentration of metals in sample
1.5 x background or Reference value : igeo ≤ 0 means unpolluted.; 0 < igeo ≤ means unpolluted to moderately polluted; 1 < igeo ≤ 2: Moderately polluted;, 2 < igeo ≤ 3 moderately to heavily polluted, 3 < igeo ≤ 4: Heavily polluted;, 4 < igeo ≤ 5: Heavily to extremely polluted, igeo > 5: Extremely polluted.
Table 9: Geo-Accumulation index of Metal in Pharmaceutical Wastewater.
The Geo-Accumulation index for the untreated water sample showed that the water sample was unpolluted by Fe, As, Ni, Zn, Hg, Pb, Cu, and Cd (IGEO ≤ 1) but was moderately polluted by Cr (IGEO ≤ 2) according to CPCB standard. This was different when compared with WHO standard as the water sample was heavily populated by Fe (3 < IGEO≤ 4) and extremely polluted by Cu (IGEO > 5) for the untreated water sample. After treatment with Iron (III) oxide, there was general reduction in the accumulation of the heavy metals by CPCB and WHO standard to unpolluted samples except for Cu and Fe which extremely polluted the water according the WHO standard (Table 9).
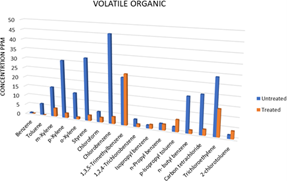
Figure 6: Results of the Volatile Organic Carbon Analysis of the Pharmaceutical Wastewater.
The samples were analyzed for concentrations of volatile organic carbon. The result (Fig 6) indicated that the samples contain several volatile organic compounds with varying concentrations of each compound which can cause detrimental effect on the environment. The result also indicated that treatment with iron (III) oxide reduced the PAH concentrations, as shown (Figure 6).
| PAH | Un Treated (mg/L) | Treated (mg/L) | % Removal |
| Naphthalene | 0.1321 | 0.0061 | 95.38 |
| Acenaphthene | 147.35 83 | 2.1586 | 98.53 |
| Fluorene | 17.3619 | 1.6156 | 90.69 |
| Phenanthrene | 105.8153 | 1.4149 | 98.66 |
| Anthracene | 156.5126 | 1.3692 | 99.12 |
| Fluoranthene | 72.4232 | 1.7898 | 97.52 |
| Acenaphthylene | 19.5162 | 0.9910 | 94.92 |
| Pyrene | 10.3511 | 0.1365 | 98.68 |
| Benzo(a) anthracene | 8.2700 | 2.2144 | 73.22 |
| Chrysene | 12.4568 | 1.8741 | 84.96 |
| Benzo (b) anthracene | 4.8752 | 2.9326 | 39.84 |
| Benzo (b) fluoranthene | 13.9971 | 4.9466 | 64.66 |
| Benzo (k) fluoranthene | 11.2197 | 7.6522 | 31.80 |
| Benzo (a) pyrene | 49.8046 | 1.4876 | 97.01 |
| Dibenzo (a, h) anthracene | 279.3877 | 1.1106 | 99.60 |
| Benzo (g, h, i) perylene | 53.4326 | 0.6513 | 98.78 |
| Indeno 1, 2, 3) pyrene | 5.4647 | 0.9528 | 82.56 |
| Total PAH | 962.9144 | 33.3039 | 96.54 |
Table 10: Poly Aromatic Hydrocarbon (PAH) Content of the Pharmaceutical Wastewater.
The samples were analyzed for the presence of poly aromatic hydrocarbon in the sample using gas chromatography. The result (Table 10) indicated that the samples contained several PAH compounds with varying concentrations which were reduced when treated with Iron (iii) oxide where average percentage removal for the total PAH was 96.54%. The observed trend in the efficiency of the mechanochemically synthesized Fe2O3 nanoparticle to decontaminate PAH in the pharmaceutical wastewater was dibenzo (a,h) anthracene (99.60%) > anthracene (99.12%) > benzo (g.h.i) perylene (98.78%) > pyrene (98.68%) > phenanthrene (98.66%) > acenaphthene (98.53%) > fluoranthene (97.52%) > benzo (a) pyrene (97.01%) > acenaphthylene (94.92%) > fluorene (90.69%) > chrysene (84.96%) > indeno (1,2,3) pyrene (82.56%) > benzo (a) anthracene (73.22%) > benzo (b) fluoranthene (64.66%) > benzo (b) anthracene (39.84%) > benzo (k) fluoranththene (31.80%). The highest concentration of PAH was Anthracene with a value of 156.51 mg/L while the lowest concentration was for naphthalene with concentration of 0.132 mg/L. The concentrations of poly aromatic hydrocarbon for the untreated pharmaceutical wastewater were above the standard by department of petroleum resource, Nigeria (10 mg/L) for discharge of waste effluents into the environment except for naphthalene (0.132 mg/L), benzo (b) anthracene (4.88 mg/L) and pyrene (5.46 mg/L) were within the threshold limit. The concentrations of the PAH in the treated pharmaceutical wastewater were all within the minimum threshold limit.
Conclusion
Parameters such as pH, chloride, total dissolved solids (TDS), and sulphate were found to meet the acceptable limits set by CPCB, EPA, and SON for both untreated and treated samples. Chloride levels were higher than CPCB standards but within EPA and SON limits. Dissolved oxygen levels exceeded CPCB, EPA, and SON standards in both untreated and treated samples. The untreated sample had a chemical oxygen demand (COD) level above CPCB limits, whereas the treated sample met the standards of CPCB, EPA, and SON. Phosphate concentrations in both samples were above the limits set by CPCB, EPA, and SON. Sulphate levels were below EPA and SON standards but above CPCB limits. Nitrate concentrations were lower in the untreated sample than in the treated one, which exceeded standards. Initial bacterial populations from untreated samples showed high counts of colonies and E. coli.
After treatment with Fe2O3 nanoparticles, bacterial counts significantly decreased, with no fecal contamination detected. Heavy metal contamination was assessed and found to be minimal in untreated wastewater, except for chromium, which had a severe contamination factor. Post-treatment, chromium contamination was reduced to moderate levels. Certain metals showed no contamination, while nickel and chromium demonstrated moderate levels in treated samples. The Pearson correlation indicated varying relationships between the contamination factors of treated and untreated samples, highlighting a strong negative correlation for chromium. The Geo- Accumulation index indicated untreated samples were unpolluted for most metals and moderately polluted by chromium according to CPCB standards. Post-treatment results showed reduced accumulation, except for copper and iron, which remained highly contaminated. Analysis for polycyclic aromatic hydrocarbons (PAHs) indicated the presence of multiple compounds. PAH levels significantly declined after treatment, with an average removal efficiency of 96.54%. The most concentrated PAH was anthracene, while naphthalene was the least. For treated samples, all PAH levels were within acceptable discharge limits. Overall, while the treated wastewater demonstrated significant improvements in meeting environmental standards, certain contaminants like copper and iron remained a concern, necessitating further monitoring.
References
1. Kodom, K., Attiogbe, F., & Kuranchie, F. A. (2021). Assessment of removal efficiency of pharmaceutical products from wastewater in sewage treatment plants: A case of the sewerage systems Ghana limited, Accra. Heliyon, 7(11): 1 - 7
2. Kummerer, K. (2009). The presence of pharmaceuticals in the environment due to human use – present knowledge and future challenges. Journal of Environmental Management, 90(8), 2354-2366.
3. Ternes, T. A., Stüber, J., Herrmann, N., McDowell, D., Ried, A., & Kampmann, M. (2003). Ozonation: A tool for removal of pharmaceuticals, contrast media and musk fragrances from wastewater? Water Research, 37(8), 1976-1982.
4. Liberty, J. T., & Echiegu, E. A. (2015). An Appraisal of the Environmental Impacts of Food Processing Industrial Waste in Nigeria. In Journal of Natural Sciences Research www.iiste.org ISSN (Vol. 5, Issue 7). www.iiste.org
5. Offiong, N. O., Lema, E. S., Kang, S., Inam, E., Kang, S. Y., & Kim, K. W. (2019a). Risk evaluation of pharmaceutical residues in waste water from selected treatment plants in Gwangju, South Korea. In J. Chem Soc. Nigeria (Vol. 44, Issue 3).
6. Adeleye, A. S., Conway, J. R., Garner, K., Huang, Y., Su, Y., & Keller, A. A. (2016). Engineered nanomaterials for water treatment and remediation: Opportunities and challenges. Materials Today, 19(5), 286-298.
7. Adewuyi, G. O., Babayemi, ; J O, & Olabanji, A. A. (2010). Assessment of Toxicity of Effluents Discharged into Waterways by Some Industries in Nigeria: A Case Study of Ibadan. In The Pacific Journal of Science and Technology-538 (Vol. 11, Issue 2).
8. Baláž, P., Achimovičová, M., Baláž, M., Billik, P., Cherkezova-Zheleva, Z., & Siška, A. (2013). Hallmarks of mechanochemistry: From nanoparticles to technology. Chemical Society Reviews, 42(18), 7571-7587.
9. Bhatnagar, A., Kumar, E., & Sillanpää, M. (2017). Nanoadsorbents for the removal of pharmaceuticals and personal care products from water. Chemical Engineering Journal, 311, 379-393.
10. Celik, N., Sezen, B., Sahin, F., Ceylan, A., Ruzi, M., & Onses, M. S. (2023). Mechanochemical Coupling of Alkylsilanes to Nanoparticles for Solvent-Free and Rapid Fabrication of Superhydrophobic Materials. ACS Applied Nano Materials, 6(16), 14921–14930. https://doi.org/10.1021/acsanm.3c02489
11. Hatshan, M. R., Khan, M., Assal, M. E., Shaik, M. R., Kuniyil, M., Al-Warthan, A., Siddiqui, M. R. H., & Adil, S. F. (2024). Green, Solvent-Free Mechanochemical Synthesis of Nano Ag2O/MnO2/N-Doped Graphene Nanocomposites: An Efficient Catalyst for Additive-Base-Free Aerial Oxidation of Various Kinds of Alcohols. ACS Omega, 9(2), 2770–2782.
12. Offiong, N. O., Lema, E. S., Kang, S., Inam, E., Kang, S. Y., & Kim, K. W. (2019b). Risk evaluation of pharmaceutical residues in waste water from selected treatment plants in Gwangju, South Korea. In J. Chem Soc. Nigeria (Vol. 44, Issue 3).
13. Omuku, P. E., Odidika, C. C., Omuku, P. E., Onuigbo, U. A., & Odidika, C. (2024). Sorption Potential of Domestic Waste as A Low-Cost Absorbent for Removal of Cu (Ii) And Pb (Ii) Ions from Aqueous Solution of Industrial Waste Effluents. https://www.researchgate.net/publication/381954340
14. Omuku, P. E., Odidika, C. C., Ozukwe, A. E., & Iwuozor, K. O. (2022). A Comparative Evaluation of Rain Water Obtained from Corrugated Roofing Sheets within Awka Metropolis, Anambra State. Iranian Journal of Energy and Environment, 13(2), 134–140. https://doi.org/10.5829/ijee.2022.13.02.04
15. Osho, A., Mabekoje, O., & Bello, O. (2010). Preliminary evaluation of wastewater effluents from two food companies in Nigeria Preliminary evaluation of wastewater effluents from two food companies in Nigeria View project MeatMicrobiology View project. https://www.researchgate.net/publication/265032268
16. Parmar, R. B., Patel, R. S., & Mistry, K. P. (n.d.). Indian Journal of Applied Research x 221Rreiew on Wastewater Effluents from Pharmaceutical Companies, 78.
17. Samal, K., Mahapatra, S., & Hibzur Ali, M. (2022a). Pharmaceutical wastewater as Emerging Contaminants (EC): Treatment technologies, impact on environment and human health. In Energy Nexus (Vol. 6). 5
18. Samal, K., Mahapatra, S., & Hibzur Ali, M. (2022b). Pharmaceutical wastewater as Emerging Contaminants (EC): Treatment technologies, impact on environment and human health. In Energy Nexus (Vol. 6). 10
19. Samira, B., Djamel, N., Rachid, C., Salim, B., & Ion, V. (2024a). Qualitative Evaluation of Pharmaceutical Industrial Effluents: Case of Study. Polish Journal of Environmental Studies,3.
20. Samira, B., Djamel, N., Rachid, C., Salim, B., & Ion, V. (2024b). Qualitative Evaluation of Pharmaceutical Industrial Effluents: Case of Study. Polish Journal of Environmental Studies, 5;23
This article licensed under the Creative Commons Attribution 4.0 International License CC-BY 4.0., which permits unrestricted use, distribution, and reproduction in any medium, provided the original author and source are properly credited.