
NL Journal of Agriculture and Biotechnology
(ISSN: 3048-9679)
Effectiveness of the Employment of Vegetable Covering as Measure of Adaptation to the Climate Change
Author(s) : Zoltan Igor Rivero Jaspe, Camilo Bonet Perez, Ayamir Agramonte Almanza. DOI : 10.71168/NAB.02.02.109
Abstract
With the objective of estimating the effectiveness of the employment of vegetable covering as measure of adaptation to make in front of the future climate in a severe scenario in the cultivations corn, rice and tomato in different productive scenarios in Camaguey province, Cuba, were considered the yields and the quantity of water in diverse irrigation regimens, condition of covering use, and a severe scenario of climatic change in three cooperatives of Camaguey province, starting from the simulation the yields and the quantity of watering water were compared among conditions of covering use and between future climatic periods and the climate bases, and was considered the effectiveness of the covering use, as for the recovery of yields in unirrigated and irrigated land; for there were simulated it through the pattern AquaCrop 6.0 cultivation campaigns starting from the study of six groups of irrigation regimens, three covering goods on the evaporation and the superficial movement of the water, twelve plantation dates and 120 years, of these, for the first 30 the meteorological data were interpolated of historical registrations and for the rest they were estimated by construction of scenarios. A database was obtained and was concluded that the covering use has a great potential as measure of adaptation and also as handling technique, but required to consider the local conditions to guarantee the success. Keywords: Scenario, Future, Yield.
Introduction
A considerable number of studies have been carried out in the country that study the impact of climate change on agriculture; of these, one group has been made in such a way that its conclusions tend to be applicable to the whole country concentrating on the potential future impact; international reference scenarios, derived from variable greenhouse gas emission conditions, ocean-atmosphere general circulation models, and even other models designed to improve accuracy such as PRECIS, and feed with biophysical crop models to make comparisons between their outputs for a future climate and a base climate.
Studies on the impacts of climate change are also usually related to adaptation measures, and this has been the case to a greater or lesser extent of those mentioned; In most of them, measures have been proposed to suggest which it is a logical step to first know an assessment of the impacts, however, generally no analogous assessment is made to quantify as far as possible the influence that these adaptation measures would have in the context that is addressed, that is, their effectiveness [1].
In a study carried out by [2] the impact of climate change on three prioritized crops in the province of Camagüey, Cuba, considered in two specific localities in future climate scenarios derived from three greenhouse gas emission scenarios for cold and spring crops, and considering or not the effect of CO2 fertilization, was addressed. using the AquaCrop 6.0 as a biophysical model.
[3] carried out a similar study extending the assessment to twelve sowing dates, corresponding to the months of the Gregorian calendar, and investigated the yields in fourteen irrigation regimes, considering rainfed and potential as extreme cases and three groups of intermediate regimes, which made it possible to specify the impact of climate change on planting margins, as well as to shed light on the context in which it would be favorable to apply certain adaptation measures, in this case concerning irrigation management.
This new work intentionally investigates the effectiveness of certain adaptation measures, in particular the use of vegetation cover as a means of conserving soil moisture and saving irrigation water.
The objective of this study is to estimate the effectiveness of the use of vegetation cover as an adaptation measure to face a future climate in a severe scenario in corn, rice and tomato crops in different productive scenarios of the province of Camaguey, Cuba.
Materials and Methods
For the study, the cooperatives “Carlos Marx”, “Victoria II” and “Daniel Readigo”, located in the north, center and south of the province respectively, were selected, which have different soil and climate conditions, which are representative of different soil and climatic conditions of the province.
These three places were represented by their predominant soils and estimated climate, at the same time, each one was assigned a certain crop and was characterized from the predominant soil (Table 1) [4].
| Production unit | Cultivation | Soil |
| "Carlos Marx" Cooperative | Corn | Typical red ferritic |
| "Victoria II" Cooperative | Tomato | Brown without carbonate |
| "Daniel Readigo" Cooperative | Rice | Quartzite Yellow leachate typical |
Table 1: Crops and soils studied by Production Unit
The cooperatives were represented in the simulations by creating files of soil input parameters, which were supplied by the UCTB Suelos Camagüey, Cuba [4].
In this work, five climatic periods were used (Table 2), with a high degree of overlap between the last four, so that the set of the first, the third, and the fifth, the base climate was the one obtained in [3], corresponding to the period 1976 – 2005, can be considered a complete representation.
| No. Order | Initial year | Final Year |
| 1 | 1976 | 2005 |
| 2 | 2021 | 2050 |
| 3 | 2036 | 2065 |
| 4 | 2051 | 2080 |
| 5 | 2066 | 2095 |
Table 2: Climamoperiods Used
First, a daily climate database corresponding to the normal period 1976-2005 was created from the six first-order meteorological stations located in the province of Camaguey, Cuba, namely, those of the territories of Florida, Santa Cruz del Sur, Esmeralda, Nuevitas, Palo Seco, and Camaguey. The selected variables were minimum, average and maximum temperatures, minimum, average and maximum relative humidity of the air, precipitation, and wind speed.
Most of the weather stations surveyed did not make systematic observations of global solar radiation during the
period of years studied, so it was estimated in all cases by the Hargreaves formula (Allen et al., 1998, cited by [5].
RG = RA * K (TMAX – TMIN)0.5 (1)
Where:
RG – radiación solar global diaria (MJ/m2)
AR – extraterrestrial solar radiation (MJ/m2)
K – adjustment coefficient
TMAX – maximum temperature (°C)
TMIN – minimum temperature (°C)
Extraterrestrial solar radiation was estimated using the standard astronomical calculations described by [6]. Previous studies by Rivero et al. (2013) using data measured at the Camagüey station concluded that the value K = 0.16 provided the best fit with the use of this expression.
For all purposes of this project, potential evapotranspirations were calculated according to the Penman-Monteith procedure [7]. The necessary formulas in this case are described in the reference literature.
The climatic variables mean wind speed and relative air humidity (or vapour tension) are used only to estimate the reference potential evapotranspiration.
Study Variables
A database of 58 Aqua Crop 6.0 output variables, a study place or area, a climamoperiod, an effect of soil cover on evaporation, an effect of soil cover on runoff, a planting date, and a crop were planned; Each of these four statisticians was assigned a table.
In each of the tables, the main key would be the set of the dimensions Place, ClimP, iR, iBV, iBS, Sowing Date, and iL, whose ranges are specified in (Table 3).
| Parameter | Description | Universe of values |
| Place | place (UBPC) | 1, 2, 3 |
| ClimP | Climaperiod | 1,2,3,4,5 |
| go | Irrigation regime | 0-5, 13-16 |
| iBV | Effect of Ground Cover on Evaporation | 0,1,2 |
| iBS | Effect of Ground Cover on Runoff | 0,1,2 |
| DateSowing | Planting month | 1-12 |
| il | Cultivate | 1,2,3,4 |
Table 3: Dimensions Studied
The central tool and biophysical crop model used in the framework of the project was AquaCrop 6.0, which has the ability to simulate the growth and development of crops throughout their cycle, taking into account the effect of carbon dioxide fertilization and the air-soil-crop plant hydrological cycle.
Due to the large number of runs needed to generate so many records, it was necessary to use programmed software. Future climate scenarios were created using the traditional methodology used in previous studies [8,9,10,11].
The correspondence between the estimated year in the future and the year that serves as a base was determined, with the data thus obtained, the corresponding input meteorological data files used by the AquaCrop 6.0 were produced.
The model does not take into account all the implications of the use of the cover, but covers only its influence on evaporation, i.e. the loss of water through the soil. Coverage also influences runoff and, therefore, infiltration, an effect that the model takes into account, but without relating it to coverage; The methodology of taking into account both effects independently is adopted, in a range of 0 to 100 % of effect on evaporation, and in a range of 0 to 20 % of the runoff curve number.
To estimate the effectiveness of the use of coverage as an adaptation measure, the following quantification was applied:
Ecb (%) = 100 % * (Acf – Af) / │(Aa - Af)│ (2)
Where:
ECB is the effectiveness of using coverage as an adaptation measure
ACF is the magnitude that is evaluated in the future with coverage applied Af is the magnitude in the future without coverage
Aa is the magnitude in the base climate without coverage
The magnitude can be the yield or agronomic productivity of irrigation water. Ecb is worth 100% when the magnitude obtained in the future under coverage has the same value as in the base climate without coverage, in which case the impact is completely reversed (Af - Aa). If it reaches a negative value, it means that the use of hedging is worse than its non-use.
The planting dates used corresponded to the 15th day of each month of the Gregorian calendar.
Results and Discussion
After the simulations carried out, the database was obtained with 34 230 records for each main table. The results of the simulation showed great diversity in the behavior of the selected farms compared to the use of hedging.
For the rainfed corn of the “Carlos Marx” cooperative, the use of the cover was both beneficial and detrimental to the yield; it was beneficial during the dry period months, while in the rainy period it was harmful to a greater degree (Fig. 1). Early in the growth cycle, evaporation is important in soil water loss, its saturation will appear more easily and last longer in the presence of cover.
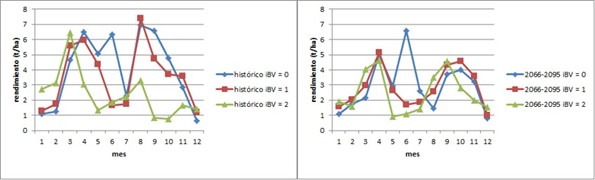 Figure 1: Yield of rainfed maize in the “Carlos Marx” cooperative for the base climate (left) and the climatic period 2066-2095 (right), given three variants of influence of cover on evaporation
In the case of rainfed rice in the “Daniel Readigo” cooperative, the same is not true, but the behavior is in line with what would be expected (Fig. 2): the effect of the cover on evaporation leads to an increase in yield in all cases. Rice does not receive damage from excess water thanks to its intrinsic characteristics, but, in addition, there are differences between the two cases between soils and climates, with soil being more likely as the main cause of the difference.
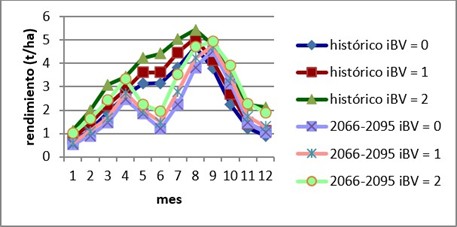
Figure 2: Yield of rainfed rice in the “Daniel Readigo” cooperative for the base climate (dark lines) and the climatic period 2066-2095 (light lines), given three variants of influence of cover on evaporation
In this case, the effect of cover on evaporation induces little change in terms of the effect of the planting date, showing little prospect that a different planting schedule with cover is advisable than without cover. The yield increase from the effect of cover on evaporation is greater for historical circumstances than for the future climate period under the circumstances represented.
In the tomato of the “Victoria 2” cooperative, as in the corn of the “Carlos Marx” cooperative, there are both positive and negative influences (Fig. 3). Here a moderate hedging effect exerts little influence, but a high hedging effect would be very detrimental except from December to March, depending on the climatic period.
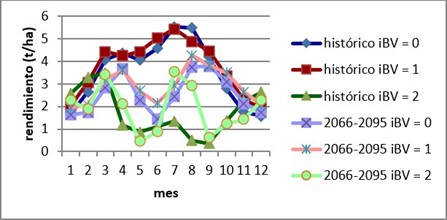
Figure 3: Yield of rainfed tomatoes from the “Victoria 2” cooperative, for the base climate (dark lines) and the climatic period 2066-2095 (light lines), given three variants of influence of cover on evaporation
A parallel comparison was made between the influence of the effect of cover on runoff (0 to 20% reduction) and that of cover on evaporation, and it was found that the influence of the former is much smaller for maize (Fig. 4) and hardly exists for rice and tomatoes (Fig. 5 and 6). In the case of rice, this occurred despite increased infiltration and consequent transpiration, but not in maize, where they frequently decreased.
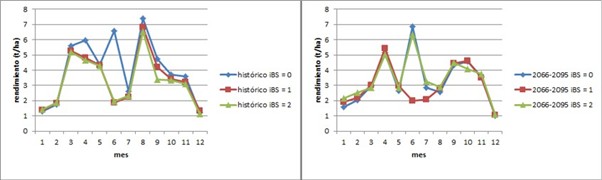
Figure 4: Yield of rainfed maize in the “Carlos Marx” cooperative for the base climate (left) and the climatic period 2066-2095 (right), given three variants of influence of the cover on runoff.
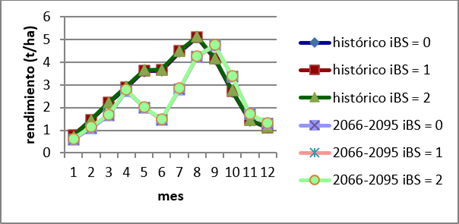
Figure 5: Yield of rainfed rice in the “Daniel Readigo” cooperative for the base climate (dark lines) and the climatic period 2066-2095 (light lines), given three variants of influence of the cover on runoff
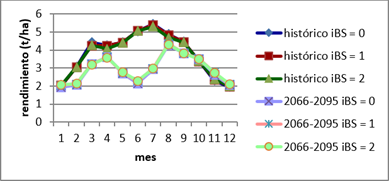
Figure 6: Yield of rainfed tomatoes in the “Victoria 2” cooperative for the base climate (dark lines) and the climatic period 2066-2095 (light lines), given three variants of influence of cover on runoff
These results coincide with those reported by [12], who, based on studies carried out in Santa Fé, Argentina, have reported the effect of cover on the reduction of runoff and water erosion; On the other hand, [13] obtained a reduction in erosion of 44 % with the use of cover based on corn residues in relation to the control.
[14] studied the effect of the inclusion of a cover crop (CC) in a soybean-soybean sequence on water and soil losses caused by water erosion in different environments of an eroded soil, concluding that water erosion processes were mitigated through increased surface cover and roughness.
The influence of the effect of the cover on evaporation on the yield of maize from the “Carlos Marx” cooperative in potential regime was unfavorable (Fig. 7). The possibility that such a change in management would have an effect on this yield is given only by the fact that AquaCrop, while ensuring that soil moisture does not fall below a certain high level, does not control that it rises above field capacity or the detrimental limit for the supply of oxygen to the roots in the event of rain. a frequent thing in a Camagüey terrain that is never far below the field capacity and also very difficult to avoid in practice if the drainage is not very fast.
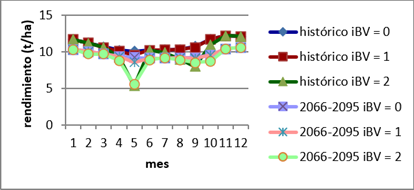
Figure 7: Yield of corn under irrigation in the “Carlos Marx” cooperative for the base climate (dark lines) and the climatic period 2066-2095 (light lines), given three variants of influence of cover on evaporation
In rice, the influence of cover on yield under the potential regime is not visible because excess moisture does not affect it and management ensures that there is no deficit (Fig. 8).
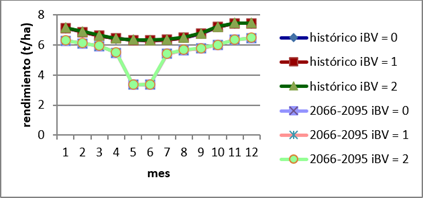
Figure 8: Rice yield under irrigation in the “Daniel Readigo” cooperative for the base climate (dark lines) and the climatic period 2066-2095 (light lines), given three variants of influence of cover on evaporation
It seems that this detrimental effect would hardly occur in the historical circumstances, because the differences between the yield for an intermediate effect on evaporation and an absence of cover are very small, but between these treatments and a maximum effect on evaporation they are large for a few months of planting, but in the tomato of the “Victoria 2” cooperative (Fig 9) it would be a generalized case.
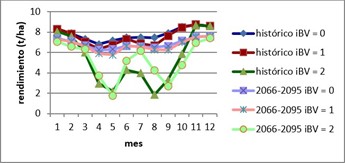
Figure 9: Yield of tomatoes under irrigation in the “Victoria 2” cooperative for the base climate (dark lines) and the climatic period 2066-2095 (light lines), given three variants of influence of the cover on evaporation
The effect of cover on yield is associated, among other factors, with the availability of nutrients for crops; in this regard, [15] reported that plots with greater coverage at the understory and canopy level had less runoff and loss of nutrients; runoff water showed a negative correlation between precipitation and total nitrogen concentrations. phosphate, electrical conductivity, temperature, nitrites, nitrate and potassium.
Figures 10 to 12 show examples of the effectiveness of the effect of cover on evaporation as a measure of adaptation to climate change in terms of rainfed yield. Two graphs are presented in each one because the extremely high efficiency values that appear mask the moderate values, of great importance, especially since most of the former are due to very low impacts of climate change, which makes them less important. Any positive value of yellow cells from 100% implies that the measure would completely reverse the impact of climate change.
As can be seen, the effectiveness varies greatly depending on the date of sowing and the whole crop, climate, and soil, both quantitatively and qualitatively. The same for corn in the “Carlos Marx” cooperative as for tomatoes in the “Victoria 2” cooperative the efficacy is generally moderate and positive for an effect of 50% coverage on evaporation, but more frequently unfavorable and of higher grade for an effect of 100%. For the rice of the “Daniel Readigo” cooperative, on the other hand, the effectiveness is always positive and much more pronounced for the 100% reduction of evaporation.
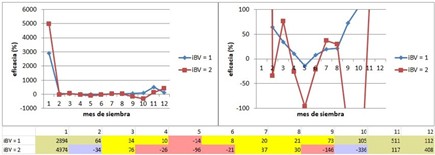
Figure 10: Effectiveness of the effect of cover on evaporation as a measure of adaptation to climate change in terms of rainfed maize yield of the “Carlos Marx” cooperative for the climatic period 2066-2095
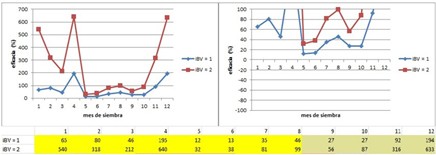
Figure 11: Effectiveness of the effect of cover on evaporation as a measure of adaptation to climate change in terms of rainfed rice yield of the cooperative “Daniel Readigo” for the climatic period 2066-2095
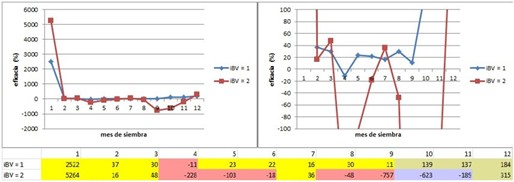
Figure 12: Effectiveness of the effect of cover on evaporation as a measure of adaptation to climate change in terms of rainfed tomato yield of the “Victoria 2” cooperative for the climatic period 2066-2095
In figures 10 to 12, the following symbology is used:
Left and right have different scales, and like the table below, they show the same dataset
Yellow cells: The measure improves performance and the impact of climate change is detrimental
Ochre cells: The measure improves performance, but the impact of climate change is not harmful, i.e. there is no impact to adapt to
Blue cells: the measure worsens performance, although the impact is not harmful
Pink cells: The measure worsens performance, already impacted by climate change
The effect of cover on evaporation has been studied in various latitudes, in Mexico [16] they found a positive
effect on this parameter, as well as on soil loss when comparing the surface with cover in relation to bare soil.
If the data used reflected the actual circumstances of these crops and locations during the present century, they would be of safe and detailed practical application; However, the results achieved show that the use of cover has great potential as an adaptation measure for increasing rainfed yields, but at the same time, it requires a local study and in balance with the real climate of the last years of each future season so as not to be harmful. A systematization and fine-tuning of technology to carry out local and rapid assessments that carry out these assessments with sufficiently realistic data together with the appropriate technological discipline would be of great benefit.
Conclusion
- The effect of cover on evaporation and runoff will increase rainfed yields in those lands where the danger of flooding is both in the current climate and in the future, while this effect may be detrimental to rainfed yields in lands where the danger of soil saturation is high.
- The use of coverage has great potential as an adaptation measure; For it to be beneficial, a local study is required and in balance with the real climate of the last years of each future epoch.
References
1. CITMA (2020). Third National Communication to the United Nations Framework Convention on Climate Change. AMA, Havana. 402 pp. ISBN: 978-959-300-170-0. pp. 204-207.
2. Rivero, R. E.; Rivero, Z. I. and M. Fumero, M. (2020). Potential and rainfed yields of maize, rice, and tomato in three climate change scenarios. Camaguey. Technical Scientific Report. 47 pp.
3. Rivero, R. E., Rivero, Z. I., & Fumero, M. (2021). Estimation and characterization of agricultural yields under different water conditions and according to the water balance of the soil-plant-atmosphere system of selected crops under conditions of the new scenarios. Camaguey. Technical Scientific Report. 51 pp.
4. SI (2020). Characterization of soils of the productive units included in the project: “Effectiveness of the use of vegetation cover as a measure of adaptation to climate change”
5. Rivero, Z. I.; Rivero, R. E.; Rivero, R. R. & Pomares, I. (2018). Climate scenarios for Camagüey as a consequence of a low intensity nuclear conflict. III International Congress on Climate Change of the IX International Convention on Environment and Development, Havana. ISBN 978-959-300-034-5
6. Rivero, R. E. (2008). Workbook of Climate Change Impacts Assessments in Agriculture: Basic Knowledge, Methodologies and Tools, CCCCC / INSMET / Commonwealth Secretariat, 148 pp.
7. Rivero R. E. (2000). Potential evapotranspiration by Penman-Monteith. Technical Scientific Report, Camagüey Meteorological Center, Cuba, 7 pp.
8. Benioff, R.; Guill, S, and Lee, J. (1996): Vulnerability and Adaptation Assessments. An International Handbook.Version 1.1. U. S. Country Studies Management Team, Kluwer Academic Publishers, Dordrecht / Boston / London.
9. Parry, M. y Carter, T. (1998). Climate impact and adaptation assessment. Earthscan Publications Limited, London, 166 pp.
10. Rivero, R. E.; Gómez, G.; A lvarez, A.; Rivero, R. R.; García, D. R. & Martínez, I. C. (1999). Agriculture and Forestry. In INSMET: Impacts of Climate Change and Adaptation Measures in Cuba. Final Project Report.
11. INSMET (2001). Republic of Cuba: First National Communication to the United Nations Framework Convention on Climate Change. National Climate Change Group, Institute of Meteorology, Havana, 97 – 119 pp.
12. Denoia, J.; Bonel, B. and Di Leo, N. (2023). Effect of cover and relief on soil losses in the Ludueña Stream basin, Santa Fe. FAVE Journal Agrarian Sciences Section. National University of the Litoral, Argentina. ISSN: 2346-9129
13. Pedroza, P. E. (2022). Impact of vegetation cover on soil erosion-deposition due to surface runoff. Journal of Agricultural Engineering and Biosystems. Vol.14, n.1, pp.17-31. ISSN 2007-3925.
14. Capurro, J. & Montico, S. (2020). Effect of cover crops on water and soil losses due to water erosion. Journal on the Hydro Environmental Issue. Vol. 26. No. 20. https://orcid.org/0000-0002-8053-7734
15. Abril, S. R.; López, T. A., & Reyes, M. J. (2017). Influence of canopy and understory on soil loss due to runoff in enhancement forest. Revista Ingeniería Hidráulica y Ambiental. Vol. 38. No. 2. Havana. ISSN 1680- 0338.
16. Huerta, O. J.; Oropeza, M. J.; Guevara, G. R.; Ríos, B. J.; Martínez, M. M.; Barreto, G. O.; Olguín, L. J & Mancilla, V. O. (2018). Effect of the vegetation cover of four crops on soil erosion. Idesia Magazine Vol.36 No.. 2. http://dx.doi.org/10.4067/S0718-34292018005000701
This article licensed under the Creative Commons Attribution 4.0 International License CC-BY 4.0., which permits unrestricted use, distribution, and reproduction in any medium, provided the original author and source are properly credited.