
NL Journal of Agriculture and Biotechnology
(ISSN: 3048-9679)
Farmers’ Demand for Agricultural Insurance in Vietnam
Author(s) : Tran Cong Thang, Truong Thi Thu Trang, Tran Thi Thuy. DOI : 10.71168/NAB.02.02.108
Abstract
This study was conducted to define risks in agriculture and determine farmers’ needs for agricultural insurance in Viet Nam. The research data was derived from direct interviews conducted with 210 households engaged in farming, livestock, and aquaculture activities. The analytical results show that both farming, livestock, and aquaculture households are negatively affected by natural disasters and diseases, in addition to grappling with escalating input and labor costs. While aquaculture and livestock households showed strong demand for agricultural insurance, rice farmers exhibited significantly lower interest. The factors influencing farmers’ demand for agricultural insurance vary depending on the agricultural products. For rice farmers, past negative experiences deter their participation in agricultural insurance, while dairy cattle farmers are more concerned about insurance premiums and claims procedures. On the other hand, white leg shrimp farmers focus more on the specific risks covered by the insurance. Keywords: Agricultural insurance, Rice, Dairy cow, White leg shrimp, Climate change, Sustainable agriculture.
Introduction
Agriculture plays an important role in the economic and social development of Viet Nam, stabilizing people’s livelihoods and being crucial in ensuring national food security as well as promoting the country’s development. However, agricultural production households are currently confronting various risks, including natural disasters, diseases, and market-related uncertainties. In 2023, the economic loss caused by natural disasters in Viet Nam were estimated at around 338 million USD [1]. The Yagi storm, which struck in September 2024, is believed to have led to a decrease in agricultural GDP of about 0.33% [2].
The demand for agricultural insurance is influenced by a complex interplay of economic, social, and policy factors. Addressing barriers such as affordability, awareness, and trust, while leveraging innovations like mobile delivery platforms and behavioral nudges, can significantly enhance adoption. Future research should focus on the long-term sustainability and impact of insurance programs, particularly in vulnerable regions. Demand for agricultural insurance varies significantly between developed and developing countries. In developed countries, comprehensive insurance products supported by robust government programs result in higher adoption rates [3]. In contrast, demand in developing regions is constrained by affordability, infrastructure challenges, and limited trust in institutions [4].
Currently, agricultural insurance is regarded as an effective risk management tool, as it is a financial instrument closely tied to agricultural business activities. It protects farmers from risks caused by uncontrollable factors, helping them minimize financial losses by providing compensation for significant damage resulting from specific risks outlined in the insurance contract. On April 18, 2018, the Vietnamese government issued Decree No. 58/2018/ ND-CP on agricultural insurance, establishing a legal framework for its implementation. Later, the Prime Minister issued Decision No. 22/2019/ND-CP on June 26, 2019, and Decision No. 13/QD-TTg on May 9, 2022, to further promote agricultural insurance policies. The scope of subsidized agricultural insurance premiums was expanded to 31 provinces and 11 agricultural products. However, to date, farmers have not shown significant interest in agricultural insurance. According to data from the Insurance Supervisory Authority and the Viet Nam Insurance Association, agricultural insurance represents a minimal portion of overall non-life insurance premiums, with this share steadily decreasing since 2015.
However, there has been little information on the farmers’ demand for agricultural insurance in Viet Nam. Therefore, the study entitled “Farmers’ demand for Agricultural Insurance in Viet Nam” aims to analyze the current state of agricultural risks and assess the demand of Vietnamese farmers for agriculture insurance. This study was carried out by the Institute of Policy and Strategy for Agriculture and Rural Development (IPSARD) as part of the ministry-level initiative titled “Study to propose solutions to push up the development of agricultural insurance” under the Ministry of Agriculture and Rural Development, Viet Nam.
Data collection
The study was conducted on three important agricultural products in Viet Nam: rice, dairy cattle, and white-leg shrimp, with a total sample size of 210 households. To ensure the study’s relevance, the research team employed multistage sampling for data collection. For each product, a representative province was selected, which is the major supply of the product and has been actively implementing agriculture insurance development policies. Similar criteria were applied in selecting one district within each province, and then communes within the district. Agricultural households were selected by commune authorities to represent the local production structure. Data collection for the study took place from June 2024 to September 2024. The survey locations and sample sizes for each product are presented in (Table 1).
| Product | Province | District | Commune | Sample size (house- holds) |
| Rice | Nghe An (located in the Central) | Yen Thanh | Long Thanh and Lang
Thanh |
70 |
| Dairy cow | Son La (located in the Northl) | Moc Chau | Moc Chau Town | 70 |
| Whiteleg shrimp | Bac Lieu (located in the South) | Bac Lieu city | Vinh Trach Dong, Vinh Trach and Ward 2 | 70 |
Source: The research team
Table 1: The survey locations by product are as follows
Quantitative data analysis was conducted using Excel spreadsheets, which is suitable for moderate sample size. Descriptive statistics were used to present the data and describe the general characteristics of the surveyed households, including the average values and the degree of variability of the computed results.
Results and Discussion
1. Rice farming households
Descriptive statistics of rice farming households
The survey results displayed in Table 2, indicate that the average age of rice farming household heads is 54 years. Regarding education level, approximately 40% of household heads have graduated from high school or higher education, with 5.71% have attained a college or university education. On average, the surveyed households consist of 4 members, with 2.5 members of working age, and 1.83 members actively engaged in agricultural production. The average annual income of the rice farming households surveyed is about 106 million VND, of which approximately 9.44 million VND is derived from rice farming activities, accounting for only about 8.9% of the total household income. Thus, it can be observed that income from rice farming is relatively modest and forms a small proportion of the household’s overall income structure.
| No | Characteristics | Unit | Min | Max | Mean | SD |
| 1 | Age of household head | Year | 38 | 75 | 53.9 | 8.09 |
| 2 | Number of family member | Person | 1 | 7 | 4.0 | 1.29 |
| 3 | Number of labours | Person | 1 | 4 | 2.5 | 0.94 |
| 4 | Number of agricultural labours | Person | 1 | 3 | 1.8 | 0.48 |
| 5 | Average household’s income | million dong/year | 10 | 400 | 105.9 | 77.65 |
| 6 | Average household income from agriculture | million dong/year | 0.5 | 150 | 19.6 | 18.53 |
| 7 | Average household income from rice production | million dong/year | 0.5 | 40 | 9.4 | 6.72 |
Source: [5]
Table 2: The characteristics of the rice farming households that participated in the survey
Current status of agricultural risks in production activities
Over the past five years, rice production in the surveyed households has been most affected by natural disasters such as storms, floods, and heatwaves. Particularly, heatwaves have occurred frequently and caused significant damage, reaching up to 33.53% of revenue (Table 3). Heavy rainfall and floods have also occurred quite regularly, with flood damage reaching up to 42%. In terms of pests and diseases, the most prevalent in rice farming are brown planthoppers, rice blast, leaf roller, and stem borers are the most common, with rice blast causing the most significant damage (46.9%), while leaf rollers cause the least damage (25%). Dry sheath disease has also been widespread, causing 31% damage.
| Natural disaster and the percentage of loss | Disease and the percentage of loss | ||||
| Natural disaster | Number of events | Percentage of loss (%) | Disease | Number of events | Percentage of loss (%) |
| Floods | 3.6 | 42.6 | Rice blast | 2.9 | 46.9 |
| Storms | 3.0 | 33.9 | Brown planthop- pers | 2.3 | 36.1 |
| Heatwaves | 5.0 | 33.5 | Leaf blight | 3.0 | 32.2 |
| Droughts | 2.5 | 25.0 | Dry sheath | 4.0 | 31.0 |
| Heavy rainfall | 4.0 | 17.5 | Yellow dwarf and leaf twisting | 2.4 | 31.0 |
| Harmful cold | 1.0 | 10.0 | Rats | 3.1 | 30.5 |
| Stem borers | 2.8 | 25.5 | |||
| Leaf rollers | 3.5 | 25.0 | |||
Source: [5]
Table 3: Natural disaster risks and disease risks that occurred over the past five years, along with the percentage of loss to rice production in the surveyed households
In addition to natural disaster and disease risks, rice farmers also face market-related challenges, particularly the rising costs of inputs such as fertilizers, pesticides, rice seeds, and the decreasing prices of paddy rice. The survey results (Table 4) show that 98.57% of rice farmers are facing various challenges, with 78.57% impacted by the escalation in fertilizer costs, 78.57% affected by the rise in pesticide prices, 70% by higher rice seed prices, and 75% by the decrease in rice selling prices. These factors have led to a reduction in harvest yields by 5-30%, with the rise in fertilizer prices contributing to a yield reduction of approximately 14.71%. Other factors, such as increased pesticide and seed prices, as well as the drop in rice prices, can lead to a decline in more than 15% in yield.
| No | Risks | Percentage of households facing risk (N=70) | Estimated yield loss (%) |
| 1 | Rising fertilizer prices | 98.57 | 14.71 |
| 2 | Rising pesticide prices | 78.57 | 15.31 |
| 3 | Rising seed prices | 74.29 | 15.73 |
| 4 | Poor quality of seeds | 70.00 | 15.06 |
| 5 | Decreasing paddy prices | 42.86 | 15.78 |
Source: [5]
Table 4: Other risks in rice production and their estimated percentage of loss
Households’ demand for agricultural insurance
When asked about their readiness to engage in rice insurance in the upcoming seasons, only 25 out of 70 households (representing 35.71%) expressed interest in purchasing the insurance. The main reason for this is the issues with the insurance compensation for rice crops based on yield indices in Yen Thanh district in 2020. There was a significant discrepancy between the yield data for the Summer-Autumn season published by the insurance company and the statistics reported by the district. As a result, many households faced reduced yields due to drought and prolonged heat but did not receive compensation or received only a minimal payout. Furthermore, the compensation process was delayed and did not provide timely assistance to help farmers recover after the disaster.
These issues have led many farmers to opt out continuing their participation in agricultural insurance for rice.
Regarding the factors influencing households’ decision to participate in agricultural insurance, farmers are particularly concerned about government fee support, the insurance premium, the claims process, and the compensation level, with over 90% of households selecting these reasons. The survey results (Figure 1) show that 69 out of 70 households would opt not to partake in agricultural insurance if there were no government fee support. This highlights that farmers still consider the cost of agricultural insurance as a financial burden, especially considering that the profit from rice production remains very low, accounting for only 8.9% of the total household income.
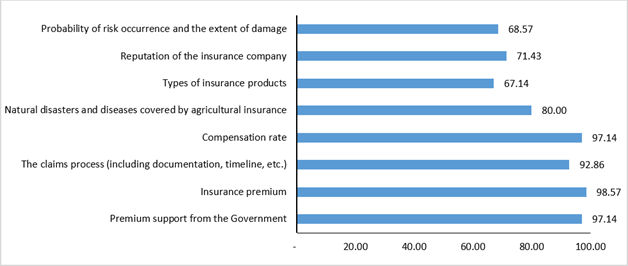 Figure 1: Factors influencing the decision of rice farmers to participate in agricultural insurance
2. Dairy cow farming households
Descriptive statistics of dairy cow farming households
The survey results show that the age of dairy cow farming household heads ranges widely, from 33 to 70 years old. Regarding educational background, 70% of household heads have completed at least high school, with 20% holding a college or university degree (Table 5). Only about 3% of household heads completed elementary school. This reflects a relatively high level of education among dairy farm household heads, suggesting improved capacity to adopt and apply technical processes and technologies in dairy farming. On average, the surveyed households consist of four members, with around two members involved in agricultural activities. All of the households surveyed are regular households, with an average annual income of about 512 million VND (after deducting production costs), of which the income from dairy farming amounts to 391 million VND (76.3% of the total household income). Therefore, it is evident that the income of these households largely depends on their dairy farming activities.
| No | Characteristics | Unit | Min | Max | Mean | SD |
| 1 | Age of household head | year | 33 | 70 | 47 | 8.6 |
| 2 | Number of family member | person | 3.0 | 6.0 | 4.4 | 1.0 |
| 3 | Number of labours | person | 1.0 | 4.0 | 2.5 | 0.7 |
| 4 | Number of agricultural labours | person | 1.0 | 4.0 | 2.2 | 0.6 |
| 5 | Average household’s income | million dong/year | 240 | 1.000 | 512.7 | 170.5 |
| 6 | Average household income from agriculture | million dong/year | 150 | 900 | 459.3 | 197 |
| 7 | Average household income from dairy cow production | million dong/year | 150 | 800 | 391.14 | 148.8 |
Source: [5]
Table 5: The characteristics of the dairy farming households that participated in the interview
Current status of agricultural risks in production activities
According to the survey, the five most common natural disasters affecting dairy cow production in Son La province are severe cold, hail, heatwaves, drought, and storms. Among these, severe cold is the most frequent, followed by hail, heatwaves, and drought. However, storms cause the greatest damage, with an average loss rate of 50% (Table 6), while other natural disasters cause losses ranging from 7% to 15% since storms can result in the death of livestock or disrupt milk transportation. Regarding diseases, the five most common diseases in dairy cow farming include bloat, diarrhea, lumpy skin disease, pneumonia, and mastitis. Mastitis occurs most frequently (3.25 times over five years), leading to a reduction in milk yield and quality, and can even cause the death of cows. Lumpy skin disease causes the greatest damage (14%), followed by mastitis (13%).
| Natural disaster and percentage of loss | Diseases and and percentage of loss | ||||
| Natural disaster | Number of events | percentage of loss (%) | Diseases | Number of events | percentage of loss (%) |
| Storms | 1.0 | 50.0 | Bloat | 1.0 | 15.0 |
| Hail | 1.3 | 15.0 | Lumpy skin dis-
ease |
1.0 | 13.8 |
| Severe cold | 1.8 | 12.8 | Mastitis | 3.3 | 12.8 |
| Heatwaves | 4.0 | 10.0 | Diarrhea | 3.0 | 9.7 |
| Drought | 1.8 | 7.2 | Pneumonia | 2.0 | 5.0 |
Source: [5]
Table 6: Natural disaster risks and disease risks that occurred over the past five years, along with the percentage of loss to dairy production in the surveyed households
In addition to the risks posed by natural disasters and epidemics, dairy farmers also face many other types of risks. Among these, the most common risk encountered by households in the last five years has been the rise in input costs, such as feed prices, occurring on average 2.4 times over the five-year period, followed by an increase in labor costs (2 occurrences in five years). Furthermore, households grapple with challenges like inconsistencies in unreliable breeding quality, reduced selling prices, rising interest rates on loans, lack of capital, unstable markets, and changes in product standards. These risks have varying levels of impact on production and household income. The increase in input costs can affect up to 30% of expected revenue (with an average loss of 13%). The other risks result in an average loss rate ranging from 5 to 10% (Table 7).
| No | Risks | Percentage of households facing risk (N=70) | Estimated yield loss (%) |
| 1 | Rising input price | 100.0 | 12.7 |
| 2 | Poor quality of dairy cow breeding | 4.3 | 5.3 |
| 3 | Rising labour cost | 77.2 | 9.9 |
| 4 | Decreasing output price | 40.0 | 5.7 |
| 5 | Rising interest rate | 20.0 | 5.7 |
| 6 | Lack of capital for production | 15.7 | 5.7 |
| 7 | Unstable market | 8.6 | 6.0 |
Source: [5]
Table 7: Other risks in dairy cow production and their estimated percentage of loss
Households’ demand for agricultural insurance
After surveying the participation demand for agricultural insurance from households involved in the interviews, 88.57% of the surveyed households stated their intention to participate in agricultural insurance. The primary reason cited for this interest is the understanding that participating in agricultural insurance guarantees compensation for damages in the event of risks occurring. The compensation will help the household minimize their losses and potentially recover production. Additionally, some households participate because they want to benefit from support and incentives from the government. Furthermore, the awareness of potential risks in the future and the damage that could occur to production is another factor driving households to participate in agricultural insurance.
Regarding the types of natural disasters and diseases that households want to be insured, the survey results show that farmers tend to choose the disasters and diseases they believe are most likely to occur and cause damage to their production in the next five years. For natural disasters, the most desired insurance coverage includes protection against severe cold (68.75%), heatwaves (28.75%), and drought (14.29%). For diseases, people prioritize insurance for mastitis (64.29%) and diarrhea. In addition to natural disaster and disease insurance, households also wish to be insured against milk price fluctuations due to the instability of the milk market. This indicates that households are quite aware of risks that could affect their production activities and are seeking solutions to mitigate risks.
Using the 9 predefined factors to measure farmers’ decision-making regarding the likelihood of purchasing agricultural insurance, the survey results show that farmers are concerned with all 9 factors outlined in (Figure 2). However, the most decisive factors influencing their decision to participate in agricultural insurance are the insurance premiums and the claims process (chosen by 100% of households). Other factors are also of significant concern to dairy farming households, with the selection rate for each factor exceeding 80%.
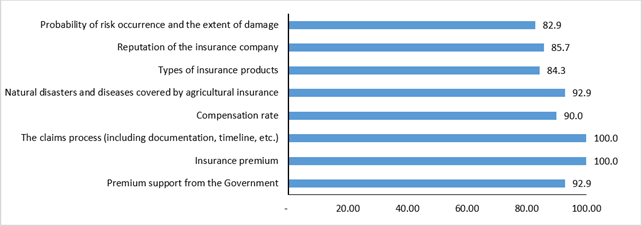
Source: [5]
Figure 2: Factors influencing the decision of dairy farmers to participate in agricultural insurance
3. Whiteleg shrimp farming households
Descriptive statistics of whiteleg shrimp farming households
In the survey involving the sample of 70 shrimp farming households, all respondents were male, with an average age of 47. Over one-third of the respondents (39%) had a high school education, 26% had completed college or university, 22% had a middle school education, and 13% either did not attend school or only completed elementary school (Table 8). The average household size was 5 people, with an average of 3 laborers per household. Most of the household laborers worked in agriculture, averaging 2.91 laborers per household, while the rest were employed in wage-based jobs or non-agricultural professions. The average annual income of the surveyed households was 312.2 million VND per household, with the average annual income from white-leg shrimp farming amounting to approximately 176 million VND per household (representing for 56.4% of the total household income).
| No | Characteristic | Unit | Min | Max | Mean | SD |
| 1 | Age of household head | year | 33 | 69 | 46.7 | 11.2 |
| 2 | Number of family member | person | 3 | 10 | 5.0 | 1.5 |
| 3 | Number of labours | person | 1 | 6 | 3.1 | 1.5 |
| 4 | Number of agricultural labours | person | 1 | 6 | 2.9 | 1.6 |
| 5 | Total household’s income | million dong/year | 50 | 1130 | 312.2 | 244.2 |
| 6 | Income from agricultural activities | million dong/year | -170 | 900 | 214.6 | 279.1 |
| 7 | Income from whiteleg shrimp production | million dong/year | -170 | 800 | 175.9 | 246.3 |
Source: [5]
Table 8: The characteristics of the whiteleg shrimp farming households that participated in the interview
Current status of agricultural risks in production activities
In the past 5 years, shrimp farming households in Bac Lieu City have faced 3 main types of natural disaster risks: prolonged heat (from December to April), off-season rain (in April), and heavy rain (in September). Prolonged heat and off-season rain happened on average 3.6 times per year, resulting in revenue damages of 30% and 20% respectively. Heavy rain occurred less frequently and caused lower average damage. These phenomena primarily affected a small area and are not included in the types of natural disasters covered by insurance. Regarding diseases, there are 7 types of diseases affecting shrimp. Among the diseases with the highest frequency, tail rot causing the most significant damage (50%), followed by intestinal diseases (47.1%) and Enterocytozoon hepatopenaei - EHP (19.2%). Although diseases like hepatopancreatic necrosis and white spot disease were less frequent, they caused significant damage (46.7% and 40%, respectively) (Table 9).
| Natural disaster and percentage of loss | Disease and percentage of loss | ||||
| Natural disaster | Number of events | Percentage of loss (%) | Disease | Number of events | Percentage of loss (%) |
| Off-season rain | 3.6 | 30.0 | Red body disease | 3.7 | 50.0 |
| Prolonged heat | 3.6 | 20.0 | Intestinal diseases | 3.3 | 47.1 |
| Prolonged heavy rain | 1.3 | 11.7 | Hepatopancreatic necrosis | 2.9 | 46.7 |
| White spot dis-
ease |
2.3 | 40.0 | |||
| EHP | 3.0 | 19.2 | |||
| Yellow head | 2.0 | 15.0 | |||
| TDP | 1.0 | 10.0 | |||
Source: [5]
Table 9: Natural disaster risks and disease risks that occurred over the past five years, along with the percentage of loss to whiteleg shrimp production in the surveyed households
Shrimp farming households are also facing many other risks that impact their production outcomes (Table 10). The risk of a decrease in shrimp prices is the most frequently reported (87%) and occurs almost every year; however, the damage level is only about 30% of revenue. The risk of poor-quality breeding, although it occurs less frequently (only 1.5 times in 5 years), causes the greatest damage, up to 73.3% of revenue. The risk from an unstable market is also quite common, leading to a nearly 25% reduction in revenue. Factors that increase production costs, such as input prices, labor costs, lack of capital, and loan interest rates, also have negative impacts. However, only 4.3% of households believe that changes in product standards by buyers cause minor damage, around 3% of revenue.
| No | Risks | Percentage of households facing risk (N=70) | Estimated yield loss (%) |
| 1 | Decreasing shrimp price | 87.0 | 29.4 |
| 2 | Rising input price | 82.6 | 16.4 |
| 3 | Poor quality of breeding | 60.9 | 73.3 |
| 4 | Lack of capital for production | 43.5 | 13.8 |
| 5 | Unstable market | 34.8 | 22.9 |
| 6 | Rising interest rate | 17.4 | 30.0 |
| 7 | Rising labour cost | 8.7 | 30.0 |
| 8 | Changes in product standards | 4.3 | 3.0 |
Source: [5]
Table 10: Other risks in whiteleg shrimp production and their estimated percentage of loss
Households demand for agricultural insurance
The survey results indicate a high demand for agricultural insurance among whiteleg shrimp farming households. Among the 35 out of 70 households that had never purchased agricultural insurance and participated in the survey, 75% stated that they planned to buy agricultural insurance to manage part of the losses from natural disasters and diseases. 25% of households that did not plan to participate in agricultural insurance (out of the 35 households that had never bought it) cited a lack of information about agricultural insurance or having never heard of it. Some industrial shrimp farmers (8.7%) believed they could manage the risks of natural disasters and control some disease risks, while the claims process was a key reason they did not intend to purchase agricultural insurance. Meanwhile, 100% of the households that had previously purchased agricultural insurance said they would be willing to buy it again in the future. The willingness to participate in agricultural insurance was still evident even if the government no longer supported insurance premiums; All the farmers surveyed expressed their intention to continue purchasing agricultural insurance if they were given detailed information about the types of insurance and associated regulations.
Regarding the risks, White-leg shrimp farming households demonstrate a strong desire for insurance coverage against diseases such as intestinal disease (39.1%), EHP (34.8%), and white spot disease (26.1%). While there is also a demand for natural disaster insurance, the interest is relatively lower. The most significant natural disaster risk identified by the households is off-season rain, with 14.7% of households selecting it as a priority for coverage.
Using the 9 predefined factors to measure farmers’ decision-making regarding the likelihood of purchasing agricultural insurance, the survey results (Figure 3) show that farmers had no opinion on the insurance premiums and the types of insurance provided. The most decisive factor influencing their decision to participate in agricultural insurance is the types of natural disasters and diseases covered, with the highest selection rate of 34.8%.
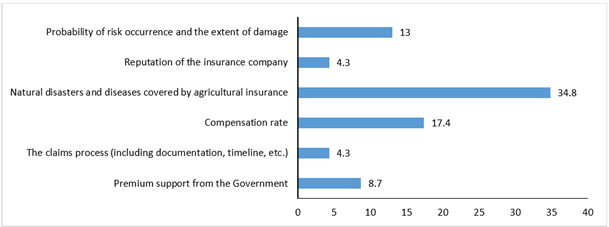
Source: [5]
Figure 3: Factors influencing the decision of whiteleg shrimp farmers to participate in agricultural insurance
Conclusion
In summary, Vietnamese farmers are facing numerous challenges and risks in the production process, which significantly affect production efficiency. The demand for agricultural insurance among producers depends on various factors, such as the level of damage caused by risks, as well as their knowledge and experience with agricultural insurance. For rice farming in Nghe An province, the demand for agricultural insurance remains very limited. The main reason for this is the shortcomings in the insurance implementation process, particularly the inaccurate determination of compensation for yield losses, leading to a loss of trust among farmers. Additionally, low incomes and limited ability to pay insurance premiums have also made it difficult for many households to participate, even though insurance could mitigate risks. For dairy farming, dairy farmers in Son La show a high demand for insurance, especially for risks such as natural disasters (severe cold, frost) and diseases (mastitis). In addition to insurance for common weather events and diseases, there is also significant interest in milk price insurance. The insurance premium rates, and the claims process are considered the two most important factors influencing the likelihood of purchasing agricultural insurance. As for white-leg shrimp farming, shrimp farmers show a very high demand for agricultural insurance. Among the 75% of shrimp farmers who had never participated in agricultural insurance, most expressed interest in purchasing insurance, while almost all farmers who had previously purchased agricultural insurance plan to continue doing so, seeing it as a way to reduce potential losses when risks occur. In fact, the government’s subsidy for insurance premiums does not significantly affect their decision to purchase agricultural insurance. Instead, there is a strong demand for disease insurance - risks that are currently not covered by insurance products available on the market. These findings match with existing literature that farmers’ perception of risk, shaped by prior experiences, strongly influences demand. Those who have experienced adverse events are more likely to purchase insurance, while the absence of immediate risks often results in reduced demand, indicating a need for behavioral interventions to address this myopia.
References
1. National Steering Committee for Disaster Prevention and Control, Economic losses caused by natural disasters in Viet Nam, Ha Noi, 2024 (Unpublished document in Vietnamese).
2. Ministry of Planning and Investment, Report on the damage caused by storm No.3 (Yagi) and solutions to overcome the consequences of storms and rain, support the recovery of production and business, National Assembly Standing Committee,Ha Noi, September 15, 2024 (Unpublished document in Vietnamese).
3. Miranda, M. J. and Farrin, K., Index insurance for developing countries, Applied Economic Perspective and Policy, 34(3):391427, 2012. https://doi.org/10.1093/aepp/pps031.
4. Hazell, P., Pomareda, C. and Valdés, A., Crop insurance for agricultural development: Issues and Experience, IFPRI, 1986.Available at https://www.researchgate.net/publication/40930191_Crop_Insurance_for_Agricultural_Development _Issues_and_Experience.
5. IPSARD, Agricultural Household Insurance Demand Survey data from the research project of Study to propose solutions to push up the development of agricultural insurance, 2024 (Unpublished document in Vietnamese).
This article licensed under the Creative Commons Attribution 4.0 International License CC-BY 4.0., which permits unrestricted use, distribution, and reproduction in any medium, provided the original author and source are properly credited.