
NL Journal of Agriculture and Biotechnology
(ISSN: 3048-9679)
Heterogenous Preference Estimation for Improved Environmental Pollution Management Strategies: Evidence from Discrete Choice Experiment among Medium and Large Scale Agro-Allied Industries in Southwest Nigeria
Author(s) : Ude Kingsley David. DOI : 10.71168/NAB.02.01.102
Abstract
The study analysed preference estimation for improved environmental pollution management strategies: evidence from discrete choice experiment among medium and large scale agro-allied industries in South-west, Nigeria. Multi-stage sampling techniques were employed in selecting 287 Medium and Large Scale agro-allied industries (M&LSAAI) (Medium Scale; MSAAI=222 and Large Scale; LSAAI=65). Data for this study was obtained from primary sources with the use of a semi-structured questionnaire. Descriptive and relevant inferential statistics such as multinomial logistic regression cum random parameter logit model were used for data analysis. The random parameter estimates on Marginal Willingness to Pay (MWTP) for improved environmental pollution management strategies (in Naira) among medium and large scale agro- allied industries in Southwest Nigeria revealed that respondents were willing to pay ₦5,838.04 for improved air PMS monthly and ₦9,751.87 for improved waste Pollution Management Strategies (PMS). In the LSAAI experiment, respondents were willing to pay ₦6,122.84, ₦5,120.46 and ₦12,491.76 for improvements in improved noise PMS, water PMS and waste PMS respectively. In the M&LSAAI experiment, respondents were willing to pay ₦4,757.26, ₦5,023.32 and ₦11,234.54 for improved noise PMS, water PMS and waste PMS respectively. The multinomial logistic regression of socio-economic factors influencing M&LSAAI preferences for improved pollution management technology options showed coefficients of age, level of education, distance to dumpsite and monthly average income to be significant for MSAAI while age, monthly average income, distance to dumpsite and size of the household were significant for LSAAI. Thus, the policy implication of this relationship between the variables and the itemized dependent variables is that government and policymakers should consider the significant variables which have an impact in determining them. Hence, the primary step should be identifying and promoting income generating programmes and upgrading the education level of the M&LSAAI managers by the state government through the states waste management agency. Moreover, the state’s waste management agency may create awareness and educate industry managers about the benefits of improved environmental pollution management technologies. Keywords: Preference, Improved Environmental Pollution Management Strategies, Discrete Choice Experiment, Medium and Large Scale Agro-Allied Industries, Nigeria
Introduction
Pollution is defined by the European Union 1996 Council Directive on Integrated Pollution Prevention and Control (IPPC) as the direct or indirect introduction as a result of human activity, of substances, vibrations, heat or noise into the air, water or land which may be harmful to human health or the quality of the environment, result in damage to material property, or impair or interfere with amenities and other legitimate uses of the environment [19]. The substances that cause pollution are known as pollutants [20,4]. A pollutant can be any chemical such as (toxic metal, radionuclides/radio-isotopes, organophosphorus compounds, gases) or geochemical substance (dust, sediment), biological organism or product, or physical substance (heat, radiation, sound wave) that is released intentionally or inadvertently by man into the environment with actual or potential adverse, harmful, unpleasant, or inconvenient effects [9,2]. Globally, the main sources of pollution are household activities, industries, agriculture and transportation, with industries ranking second after transportation [14,11].
There is a wide range of industries and the pollutants introduced into space largely depends on the type and scale of industrial operation, raw material characteristics, specific process methods, efficacy of facilities, operating techniques, product grades and climatic conditions [15]. Over 40% of the total volume of environmental pollution in Nigeria originates from medium and large scale agro-allied industries especially food and beverage processing industries, food manufacturing, chemical products (fertilizers), livestock production (poultry, pig etc.) and agro- based industries (palm oil, rubber manufacturing, and leather and textile products) etc. [10]. Medium and large scale (MLS) agro-allied industries can be differentiated by the number of employees [24]. According to Mariel et al. [21], medium scale agro-allied industries are those with between of 100 and 199 employees while large scale agro-allied industries are usually those with 200 employees or more. The magnitude of environmental pollution problem in MLS agro-allied industries is generally related to the methods of pollution management which are subject to the type of pollution [27]. Over the past couple of decades, various types of pollution have been identified that altered the composition of water, air, and soil of the environment. Depending on the nature of pollutants and also subsequent pollution of environmental components, pollution may be categorized as follows: air pollution, water pollution, soil/land Pollution, noise pollution, radioactive pollution and thermal pollution. Among these types of pollution, water, air, noise and land pollution are the main types threatening the environment, humans, plants, animals, and all living organisms in Nigeria [25].
Nigeria has not yet reached the internationally accepted standards for industrial waste disposal and environmental pollution management compared to some other countries around the world (such as USA and Canada) [26]. In more developed countries, the most common environmental pollution management technologies employed by MLS agro-allied industries are scrubbers, noise mufflers, incinerators, anaerobic digesters, Industrial Pollution Projection System (IPPS), end-of-pipe treatment and Cleaner Production (CP) [27]. On the other hand, developing countries who still rely on crude or traditional technologies to produce high end products leading to a significant amount of environmental pollution so as to avoid high disposal cost and expenditure [23]. In Nigeria, environmental pollution is particularly notable in cities like Ile-Ife, Kaduna, Nnewi, Aba, Lagos, Ibadan, Abeokuta, Ilorin, Port Harcourt, Akure, Sango Otta/Ijoko, Osogbo, Ilesha, Ishagamu, Kano, Ijebu-Ode and Lokoja etc., most of which are of the Southwest region of Nigeria [6,18]. Also, it is evident that MLS agro-allied industries in South west Nigeria are one of the major sources of environmental pollution and various levels of the pollutants are discharged into the environment either directly or indirectly which gradually become a sink for pollutants from these industries and the Lagoons [21].
Research on environmental pollution management has explored a variety of approaches, such as extended belief rule-based systems, choice experiments, and economic valuation techniques. Ye et al. [31] introduced an extended belief rule-based method for pollution management, while Mu et al. [22] and Li et al. [19] used choice experiments to assess preferences for pollution control in rural and agricultural contexts. Moreover, Combes et al, [11] and Zhang et al, [32] examined public preferences for environmental protection, though their studies primarily focused on the general public rather than industrial stakeholders. Sridhar et al. [27] provided insights into small business environmental policies in Nigeria and Ghana, but did not address medium and large-scale agro-allied industries. Further studies, such as United Nations Environmental Programme [30] and Ye et al. [31], analysed pollution control preferences and health impacts in urban and household contexts but did not focus on industrial sectors. Zhang et al. [32] highlighted the importance of pollution-prone industries in regional economies but left out specific industry preferences. These studies reveal a gap in understanding the heterogeneous preferences of medium and large-scale agro-allied industries in pollution management, especially in developing countries like Nigeria, where tailored strategies are needed to address industry-specific environmental challenges. In this regard, there is an urgent need to seek workable economic solutions to the problem of environmental pollution in South west Nigeria. It evident is clear that from the researchers’ knowledge, little or nothing has been done on economic analysis of environmental pollution management strategies pertaining medium and large scale agro-allied industries (M&LSAAI) in Southwest Nigeria from a behavioural economic perspective and proffering solutions to the following core research questions:
1. What preferred improved pollution management option would M&LSAAI managers key into or would more prefer to operate on the status quo?
2. Which particular improved pollution management attribute has significant magnitude of influence to M&LSAAI managers’ choice and what socio-economic determinants influences their decisions?
Objectives of the Study
The broad objective of the study is to analyze heterogenous preference estimation for improved environmental pollution management strategies: evidence from discrete choice experiment among medium and large scale agro-allied industries in South-west, Nigeria. The specific objectives were to:
1. To describe stated preference choices made by medium and large scale agro-allied industries based on improved environmental pollution management strategies in relation to the status quo.
2. To estimate marginal willingness to pay and identify improved pollution management attribute with most significant magnitude of influence to M&LSAAI choice.
3. To estimate medium and large scale agro-allied preferences for improved environmental pollution management strategies.
4. To analyze socio-economic factors influencing M&LSAAI preferences for improved pollution management technology options.
5. To identify reasons for not having efficient environmental management technology among medium and large scale agro-allied industries.
Research Methodology
The study was carried out in Southwest region Nigeria. South west Nigeria is made up of six states which include: Ekiti, Lagos, Ogun, Oyo, Osun and Oyo states. This region falls within latitudes 6˚ N, 4˚S and longitudes 4˚W, 6˚E; covering about 114, 271 kilometre square [1]. Multi-stage sampling techniques were employed in selecting 287 MLS agro-allied industries. Data for this study were obtained from primary sources with the use of semi- structured questionnaire. The data for the study was achieved using both descriptive (Choice Modelling (CM)) and inferential statistics such as Multinomial logistic regression cum Random Parameter Logit model. The Hypotheses were tested using the probability value of Likelihood Ratio Chi Square test.
Model specification
Multinomial Logistic Regression Model and Random Parameter Logit
Multinomial Logistic Regression Model and Random Parameter Logit were used to estimate preferences and socio-economic factors influencing M&LSAAI preferences for improved pollution management technology options.
Choice Experimental design
he first step in choice experiments involves selecting relevant attributes and assigning realistic levels to each attribute. Selected levels assigned to each attribute should be feasible, realistic, non-linearly spaced, and should span the range of respondents’ preference maps [12]. Both attributes and levels were deduced from a literature review, focus groups, pilot studies, and expert consultations. After attributes were identified and relevant levels assigned to each attribute, experimental design commenced. Experimental design is explained as the specialized and scientific manipulation of the levels of one or more attributes to generate choice profiles [13]. The most common classes of experimental design in the literature are full factorial, orthogonal, and efficient designs. This section discusses the attributes and levels that was used in the study to analyze preference estimations and socio- economic factors influencing M&LSAAI preferences for improved pollution management technology options as well as how they are experimentally designed into choice profiles.
Hypothetical scenario for preference options
If the Federal Government through the National Environmental Standards and Regulations Enforcement Agency (NESREA) proposes hypothetically a cost share policy to enact improved pollution management technologies and MLS agro-allied industries are presented with sole option to choose from in order to control environmental pollution, what preferred option would MLS agro-allied industrialist key into or would they still prefer to operate on the status quo?
Attributes and levels
In determining the attributes for the experiment, the research used a combination of both literature review and expert consultation. The designed choice card is specified below:
| Attributes | Description | Economic benefits | Attribute levels |
| Noise pollution man- agement technology devices | A typical M&LSAAI has noise pol- lution level of 95dB (0 - >120dB). Installation of efficient air pollution management technologies such as acoustic panel technology and use of resilient isolation clips or Damping Pads will reduce noise pollution by 70% and 65% respectively. | Removal of noise from heavy machineries/indus- trial plants | Level 1: Acoustic panel technology by damping
Level 2: Use of resilient isolation clips or Damping Pads |
| Air pollution man- agement technology devices | A typical M&LSAAI has air pollu- tion level of 145AQI (Calibration: 0-500AQI). Installation of efficient air pollution management tech- nologies such as wet flue gas, fuel denitrogenation, gravitation settling chambers and cyclone separator will reduce air pollution by 80%, 70% and 65% respectively | Particulate detection and emission control | Level 1: Wet flue Gas Desulfuriza- tion system
Level 2: Fuel Denitrogenation Level 3: Gravitational settling chambers and Cyclone separator |
| Water pollution management tech- nology devices | A typical M&LSAAI has water pollution level of 50WQI (Calibra- tion: 0 - > 60WQI). Installation of efficient water pollution manage- ment technologies such as portable chemical solution neutralization wet processing cart, sludge treat- ment and bio-filtration will reduce water pollution by 75%, 70% and
50% respectively |
Neutralization of waste water for safe discharge | Level 1: Improved End of pipe solutions (Portable Chemical solution neutralization wet processing cart)
Level 2: Improved sludge treat- ment Level 3: Improved Process- integrated technology solutions (bio-filtration) |
| Waste pollution management tech- nology devices | A typical M&LSAAI generates 67,258 kg d-1 of waste. Installation of efficient waste pollution manage- ment technologies such as Anaero- bic digester, Ensiling and incinera- tor will reduce waste pollution by 70%, 60%, and 50% respectively | Methane/biogas pro- duction for electricity generation & cooking cum healthy/odourless manure; Healthy indus- trial enterprise environ- ment, | Level 1: Anaerobic digestion Level 2: Waste management by improved ensiling/deep stacking/biochar sequestration technologies |
| Pollution manage- ment technology Bill | The fixed waste management bill for M&LSAAI is ₦18,000 per annum for solid waste and additional cost from literature was ₦67,000 giving a total of ₦85,000. Installation of more efficient environment pollu- tion management technologies will slightly reduce the yearly environ- mental management bill by 1.2, 1.5,
1.8 and 2.5 units. |
Despite the inefficiency of the current waste/ pollution management provided by the govern- ment, an average indus- try in South west Nigeria pay ₦7500 monthly as waste management bill. The question is: what choice combination can they be WTP less for? | Level 1: ₦80,000/year
Level 2: ₦70,000/year Level 3: ₦60,000/year NB: This bill also covers installa- tion, maintenance and repair cost of proposed technological devices |
The attributes and levels presented in Table 1 were experimentally designed into choice set profiles. In addition to the designed profiles, the study also included a status quo (SQ) profile. SQ profile essentially avoids the undesirable effects associated with forced choices. The study used an undefined SQ in each choice set. In the context of the study, it is essential to examine the MWTP observation in MSAAI, LSAAI and M&LSAAI. To do this, the study used the mixed logit (MXL) model as an estimation tool. To estimate utility functions, the study adopted unconstrained MXL models where five attributes were modelled as normally distributed random parameters while alternative specific constant (ASC) was modelled as a fixed parameter. Utility models estimated in this study are defined as:
![]()
Parameter β0 represents the ASCs, while parameters β1 to β5 are coefficients of attributes and Ԑij is the random error component. The dependent variable “preferences for improved pollution management technology options” have n possible values hypothesized to be function of some socio-economic characteristics of M&LSAAI explanatory variables for an extended Multinomial logit model. These hypothesized variables are:
Dependent Variable:
Y = Preferences for improved pollution management technology options
Explanatory Variables (Independent Variables):
X1 = age of M&LSAAI managers (continuous variable: Years);
X2 = sex of M&LSAAI managers (dummy variable; male = 1; female = 0);
X3 = marital status (nominal variable: single = 1; Married = 2; widowed = 3; divorce = 4; separated = 5);
X4 = educational level M&LSAAI managers (continuous variable: number of years spent in school);
X5 = Satisfaction with the status quo (dummy variable; yes= 1; otherwise = 0);
X6 = monthly agro-allied industrial income (continuous variable: Naira); X7 = distance to dumpsite (continuous variable: kilometre);
X8 = awareness level of National environmental standards and regulations enforcement agency (NESREA) policy on pollution control (ordinal variable: high awareness = 3, medium awareness = 2, low awareness = 1, no awareness =0);
X9 = agro-allied Industrial size (continuous variable: number of employees);
X10 = membership of association/industrial organization (dummy variable; yes = 1; otherwise = 0);
X11 = formal training on environmental pollution control (continuous variable; number of times M&LSAAI attended formal training on environmental pollution control)
X12 = distance to residential buildings (continuous variable: Kilometres);
X13 = exposure to mass media on environmental pollution control (number of mass media exposure on environmental pollution control per month);
X14 = years of agro-allied industrial experience (continuous variable: Years); and
X15 = household size of M&LSAAI managers (discreet variable: number of heads in a particular house).
𝜇 = Error term
Results and Discussion
Preferences for improved environmental pollution management strategies
Stated preference choices made by medium and large scale agro-allied industries in relation to the status quo
The Figure 1 depicts the frequency distribution of stated preference choices made by medium and large scale agro-allied industries based on improved environmental pollution management strategies/options in relation to the status quo. Presenting the frequency distribution of how each alternative was chosen in each experiment is important when checking if choices were consistent across the experiments. Where consistent choices are observed across the experiments, it makes the comparison of empirical estimates possible. However, if inconsistencies across experiments imply that the nature, scale or size or other factors affected respondents’ choices. Figure 1 below shows that options 1 and 2 had an almost equal chance of being selected by respondents, implying that there were real trade-offs between the two options. In other words, the result revealed a more balanced preference for improved EPMS (options one and two) suggesting a near equilibrium in random taste variation across respondents, possible unrestricted substitution patterns across choices, and possible near perfect correlation in unobserved factors. This judgment is based on from percentage proximal of 46.8% and 42.8% among MSAAI, 41.5% and 44.6% among LSAAI and 45.6% and 43.2% among both M&LSAAI for options one and two respectively.
To further support this, the result reveals a very low average proportion (11.8%) in preference for the status quo with a slightly below average proportion (44.7% and 43.5%) preferences for options one and two. Concerning the status quo, the study found out that large scale agro allied industries (13.8%) slightly preferred the status quo more than medium scale agro-allied industries (10.3%) combined with the pooled data of M&LSAAI (11.1%) possibly based on enterprise scale. Large scale agro-allied industries might have been more independently possessive of environmental pollution management technologies or already had been employing more sophisticated or rather industrially favourable environmental pollution management strategies leading to a slight differential in preference of the status quo compared to their medium scale agro-allied industrial counterpart. In a different vein, medium and large scale agro-allied industries being significant producers of industrial effluents/waste with large number of employees to cater for, might have devised possible environmentally unpalatable or illicit measures to deal with their huge waste/pollution effects with less interest on externalities as far as it may be less detrimental to the industry’s leading to preferences in the status quo.
Generally, the preference for improved environmental pollution waste management above the status quo might have been triggered possibly with the need to provide cleaner and safer environment, reduce environmental waste hazards, protect the aesthetic values of the industries, reduce health risk ignited by poor environmental conditions and ensure a more sustainable environment void of unfavourable pollution effect. This finding is somewhat similar to the study by Mariel et al. [21] who discovered an average proportion similarity (between 45% and 55%) response for options one and two among households in their preferences for presentations formats (text only, visuals only and text and visuals) akin to improved household technologies such as water efficient technologies in relation to the status quo (which was less than 10%).
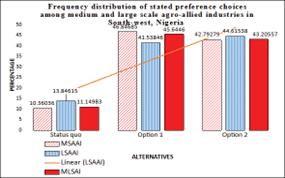 Figure 1: Frequency distribution of stated preference choices made by medium and large scale agro-allied industries with reference to improved environmental pollution management strategies in relation to the status quo (Field survey, 2023).
Estimates on Marginal Willingness to pay (MWTP) for improved environmental pollution management strategies (in Naira)
Table 2 presents estimates on MWTP for improved in environmental pollution management strategies (in Naira) among medium and large scale agro-allied industries in South west Nigeria. The econometric estimates were derived using two multinomial logit models: The basic model (which included only the attributes) (Table 2) and the model which included the socioeconomic and demographic variables (hereafter called the extended model) (Table 4) together with one random parameter logit model (Table 3). Table 2 presents the empirical findings of the basic model. The basic model is a multinomial model estimated by maximum likelihood estimation method. The result of the multinomial logistic regression model yielded a log likelihood of -2053.584, -987.2628 and -492.2932 with a Quasi-LR statistic of 9.055064, 1.294000 and 1.403022 for medium scale, large scale and pooled M&LSAAI which were significant at 1%, 5% and 5% levels of probability respectively. This is an indication that the explanatory variables included in the model jointly explained the variations in marginal willingness to pay among the categories of respondents in the study area. The McFadden’s R squared values of 0.471780, 0.499282 and 0.569392 indicate good model fit.
Hypothesis and post estimation test
It was hypothesized that selected attributes do not have significant magnitude of influence to M&LSAAI choice of environmental pollution management options. However, the analysis test results revealed that the selected attributes had significant magnitude of influence to M&LSAAI choice of environmental pollution management options. This was justified by the Probability (LR statistic) which is the probability value which signifies the statistical significance of the LR statistic of the three multinomial logistic regression models (MSAAI, LSAAI and M&LSAAI) which were significant at the 1% and 5% significant level (P<0.05). Therefore, the null hypothesis was rejected and the alternate hypothesis accepted.
The standard error indicating the degree of deviation occurs from predicting the slope coefficient estimate or summary measure based on the estimated variance of the residuals. The standard error for MSAAI, LSAAI and pooled M&LSAAI was 45.50868, 10.03855 and 13.30445 respectively. The sum squared residual implies sum of squared residuals for the model (explained variation in MWTP) and residuals (unexplained variation in MWTP). Points outside the regression line are referred to as residuals, with points explained by the model are known as Explained Sum of Squares (ESS) while those attributable to random nature, which are outside the model are known as Residual Sum of Squares (RSS) viz: 1176.295, 344.1528 and 323.1289 for MSAAI, LSAAI and pooled M&LSAAI respectively. Mean dependent variances viz: 7,3427.23, 10,339.74 and 8,394.03 for the MSAAI, LSAAI and M&LSAAI indicates the average value of MWTP in naira. The S. D. dependent variance of 1455.0868, 967.321 1365.12 indicates the deviation from the average value of MWTP in the data.
It is also common practice in the literature to compare empirical estimates on the measures of welfare across medium scale, large scale and pooled medium and large scale agro-allied industries [9]. This section presents MWTP estimates, which are commonly used as welfare measures in the literature. MWTP estimates show the average estimates of what respondents are prepared to pay for or against improvements in each attribute. Positive and significant Figures show the average amount industry managers are willing to pay for improvements in the attribute, whereas negative and significant Figures show how much industry managers are willing to accept as compensation for changes in the attribute. Empirical estimates for MWTP for the study are interpreted to mean that for the MSAAI experiment, respondents are willing to pay ₦5,838.04 for improved air PMS monthly and ₦9,751.87 for improved waste PMS. In the LSAAI experiment, respondents are willing to pay ₦6,122.84, ₦5,120.46 and ₦12,491.76 for improvements in improved noise PMS, water PMS and waste PMS respectively. In the M&LSAAI experiment, respondents were willing to pay ₦4,757.26, ₦5,023.32 and ₦11,234.54 for improved noise PMS, water PMS and waste PMS respectively. Two main observations are made from a comparison of the statistical significance of the MWTP estimates. Firstly, the LSAAI experiment has more MWTP estimates that are significant at 1% probability level than the other two experiments, which have two significant MWTP estimate at 1% in the case of MSAAI experiment and 1% cum 5% probability level with respect to the pooled experiment (M&LSAAI). This observation is consistent with earlier results on utility functions, where the large-scale industrial experiment also emerged as having more attribute parameter estimates that were significant than the other experiments [22].
Secondly, the result reveal substantial variations in the MWTP estimates reported in the LSAAI experiment are larger in absolute terms (₦12,491.76) than those from both the MSAAI and the pooled experiments. Therefore, by implication, waste PMS is identified as the improved pollution management attribute with most significant magnitude of influence to M&LSAAI choice. When the sizes of MWTP estimates for MSAAI and the LSAAI experiments are compared, it can be observed that the latter has more estimates that are superior than the former in absolute terms. This agrees with apriori expectations that LSAAI will be more willing to pay more naira for improvement in environmental pollution management strategies and as such tend to produce estimates that are mostly greater than those from MSAAI experiments, in absolute terms [26].
Overall, the result depicts that MWTP estimates were largely different in terms of sign, significance and magnitude across the MSAAI, LSAAI and M&LSAAI. Based on these results, the study argued that the MSAAI, LSAAI and M&LSAAI are affected by the environmental pollution and are willing to allocate funds ranging between ₦4757.26 and ₦12,491.76 for improved environmental noise, air, water and waste PMS. Finally, the coefficient for annual charges to be borne by industry managers or the service rendered (Bill) is negative and significant indicating the decrease in utility for respondents as the annual charges increase This indicates that MSAAI, LSAAI and pooled M&LSAAI may become less willing to pay for changes as the charges keep increasing.
| MLRM (Basic model) | Medium Scale Agro-allied Industry | Large Scale Agro-allied Industry | Pooled data | ||||||
| Discrete choices | Coefficient | Std. Error | z-Statistic | Coefficient | Std. Error | z-Statistic | Coefficient | Std. Error | z-Statistic |
| ASC | -7465.53*** | 0.305580 | -2.443068 | -66145.8*** | 0.571661 | -4.157080 | -2472.45*** | 0.014654 | -4.502122 |
| Noise PMS | -12535.74 | 0.058457 | -0.144424 | 6122.84*** | 0.109895 | 4.557112 | 4757.26** | 0.032012 | 1.752042 |
| Air PMS | 5838.04*** | 0.035609 | 3.797189 | -8188.33 | 0.069009 | -1.186567 | -8548.56 | 0.056887 | -1.113012 |
| Water PMS | 32734.97 | 0.040173 | 0.008143 | 5120.46*** | 0.075964 | 6.158570 | 5023.32** | 0.003523 | 1.684093 |
| Waste PMS | 9751.87*** | 0.049295 | 6.509535 | 12491.76*** | 0.094340 | 5.238405 | 11234.54*** | 0.000434 | 6.029030 |
| Bill | -4592.30*** | 0.893921 | -5.490231 | -7291.10*** | 0.001223 | -8.490121 | -6120.19*** | 0.010201 | -5.012930 |
| Mean dependent var | 73427.23 | 10339.74 | 8394.03 | ||||||
| Sum Squared residual | 1176.295 | 344.1528 | 323.1289 | ||||||
| Restricted Quasi-logl | -2074.188 | 1987.308 | 1029.190 | ||||||
| Prob (Quasi-LR stat) | 0.000888 | 0.025510 | 0.024902 | ||||||
| Standard error | 45.50868 | 10.03855 | 13.30445 | ||||||
| McFadden R squared | 0.471780 | 0.499282 | 0.569392 | ||||||
| Log likelihood | -2053.584 | -987.2628 | -492.2932 | ||||||
| Quasi-LR statistic | 9.055064 | 1.294000 | 1.403022 | ||||||
| Pearson SSR | 24219.72 | 1559.991 | 1230.402 | ||||||
| S.D dependent var | 1455.0868 | 967.321 | 1365.12 | ||||||
Table 2: Estimates on MWTP for improved environmental pollution management strategies (in Naira)
Source: Field survey, 2023; *** Significant at 1%; ** Significant at 5%; * Significant at 10%
Estimation results on medium and large scale agro-allied preferences for improved EPMS in the study area
In the context of multinomial logit models, the Independence of Irrelevant Alternatives (IIA) assumption is crucial, suggesting that each alternative must be independent of the others. IIA is an assumption which states that each alternative must be independent of each other [5]. The most common approach to look at whether the IIA assumption holds or not is the standard Hausman test. However, for the study case, the test could not be completed due to the non-positive definiteness of the difference matrix. Results of Multinomial Logit models are biased if the IIA assumption is violated. Since the Hausman test cannot be completed, using Random Parameter Logit Model does better. Given the constraints with the Hausman test, the utilization of the Random Parameter Logit Model proves to be more efficient. To account for this the Random Parameter Logit Model is estimated as follows. In this model, the interpretation of results was based on the sign, magnitude and statistical significance of the random parameters. The parameter estimate of each attribute indicates the utility derived by respondents. To be specific, the sign of the parameter estimate shows the direction of the relationship between an attribute and the respondents’ utility derived, while the magnitude of the parameter estimate shows the extent of the impact. The statistical significance of the parameter estimate shows the importance of an attribute to respondents. Positive parameter estimates show that respondents prefer improvements in the attribute (bill, being the economic aspect of attributes), whereas negative estimates show that respondents do not prefer improvements [21].
Using the attribute parameter estimates reported for noise PMS in all three models, the results are interpreted to mean that MSAAI and pooled M&LSAAI prefer improved Noise PMS. In the MSAAI model, for example, a unit improvement in the noise PMS will increase respondent’s utility by approximately 0.06%, technically, a 10% improvement in Noise PMS increase the respondent’s utility by about 0.6%. In the same vein, in the pooled M&LSAAI model, a unit improvement in the Noise PMS will increase respondent’s utility by approximately 0.11%. For air PMS, in the LSAAI model, a unit improvement in the air PMS will increase respondent’s utility by approximately 0.14%. For water PMS, in the LSAAI and pooled M&LSAAI models, a unit improvement in the water PMS will increase their utilities by approximately 0.13% and 0.15% respectively. With respect to waste PMS, the result indicated that a unit improvement in the waste PMS will increase MSAAI, LSAAI and pooled M&LSAAI utilities by approximately 0.05%, 0.09% and 0.11% respectively.
Regarding the negative attribute parameters, a unit increase in the bill, for example, reduces the respondent’s
utility (MSAAI, LSAAI and M&LSAAI) by 0.072099, 0.117423 and 0.134095 which on the average is approximately
0.11 across all the three models. This implies that when making choices, respondents did not prefer alternatives with higher EPMS bills. Variations in the sign and magnitude of parameter estimates across experiments are interpreted to mean that industrial scale of operation affects empirical results. Results show negligible differences in the magnitude of the parameter estimates for each attribute across the MSAAI, LSAAI and M&LSAAI. The magnitudes of the parameter estimates are well within the same range, in absolute terms. This result is consistent with the findings from Arimah and Adinnu [6] and Ayoola et al. [7], where the size of the coefficients in absolute terms showed little difference across different experiments. However, the result estimates are not consistent with results in similar studies that show large coefficients for medium scale industrial experiments compared to large scale industrial experiments [7,8,9].
The empirical results show considerable differences in the signs of attribute parameter estimates across experiments. Only waste PMS and Bill reported parameters with the same signs across the MSAAI, LSAAI and M&LSAAI. Nevertheless, some similarities are observed when comparisons are made between any two of the MSAAI, LSAAI and M&LSAAI. For example, noise PMS has the same sign in the MSAAI and pooled M&LSAAI experiments, water PMS has the same sign in the LSAAI and pooled M&LSAAI experiments. An analysis of the significance of the parameter estimates presented in Table 3 above shows only three attributes are significant in the MSAAI experiment, while four attributes are significant in the LSAAI experiment and four attributes are also significant in the pooled M&LSAAI experiment. Bill is the only attribute that is significant at 1% across all MSAAI, LSAAI and M&LSAAI. Perfect examples of studies whose findings are consistent with the study include [16,20].
|
Mixed logit/RPL Attributes |
MSAAI | LSAAI | M&LSAAI | |||
| Parameter estimate | Std. Error | Parameter estimate | Std. Error | Parameter estimate | Std. Error | |
| Noise PMS | 0.060509** | 0.028945 | 0.098547 | 0.047067 | 0.112539* | 0.053754 |
| Air PMS | 0.088957 | 0.058552 | 0.144879** | 0.095361 | 0.165449 | 0.108921 |
| Water PMS | 0.084743 | 0.048016 | 0.138015*** | 0.078201 | 0.157611*** | 0.089303 |
| Waste PMS | 0.05930** | 0.024234 | 0.096586*** | 0.039468 | 0.110344*** | 0.045072 |
| Bill | -0.072099*** | 0.075411 | -0.117423*** | 0.122817 | -0.134095*** | 0.140254 |
| Non-random parameters in utility function | ||||||
| ASC | 0.000000 | 0.218490 | 0.000000 | 0.420783 | 0.000000 | 0.601192 |
| Diagonal values in Cholesky matrix, L. | ||||||
| Ns.Noise PMS | 0.063291*** | 0.030228 | 0.027272*** | 0.013025 | 0.049759*** | 0.023766 |
| Ns.Air PMS | 0.093047*** | 0.061244 | 0.040093*** | 0.026393 | 0.073153 | 0.048151 |
| Ns.Water PMS | 0.088639*** | 0.050223 | 0.038194 | 0.021641 | 0.069688 | 0.039486 |
| Ns.Waste PMS | 0.062031 | 0.025348 | 0.026729 | 0.010922 | 0.048769 | 0.019928 |
| Ns.Bill | 0.075414 | 0.078877 | 0.032495 | 0.033988 | 0.05929 | 0.062013 |
| Below diagonal values in L matrix = L*Lt | ||||||
| Air PMS*Noise PMS | 0.085224 | 0.010227 | 0.121364 | 0.014564 | 0.197784 | 0.023734 |
| Water PMS*Noise PMS | 0.125292*** | 0.015035 | 0.178423 | 0.021411 | 0.290772** | 0.034893 |
| Water PMS*Air PMS | 0.119356 | 0.014323 | 0.169977 | 0.020396 | 0.276996 | 0.03324 |
| Waste PMS*Noise PMS | 0.0835288* | 0.010023 | -0.118949*** | 0.014274 | -0.193848** | 0.023262 |
| Waste PMS*Air PMS | 0.101548 | 0.012186 | 0.144615 | 0.017353 | 0.235668 | 0.02828 |
| Waste PMS*Water PMS | 0.040704** | 0.004884 | 0.057965 | 0.006956 | 0.094464*** | 0.011336 |
| Bill*Noise PMS | 0.082468** | 0.009896 | -0.117439* | 0.014093 | 0.191388** | 0.022967 |
| Bill*Air PMS | 0.067628 | 0.008115 | 0.096306 | 0.011557 | 0.156948 | 0.018834 |
| Bill*Water PMS | -0.034132*** | 0.004096 | -0.048606** | 0.005833 | -0.079212*** | 0.009505 |
| Bill*Waste PMS | 0.106212* | 0.012745 | -0.151252*** | 0.018152 | -0.246492** | 0.029579 |
| Standard deviations of parameter distributions | ||||||
| sdNoise PMS | 0.012816*** | 0.006121 | 0.050868*** | 0.024295 | 0.037817*** | 0.018062 |
| sdAir PMS | 0.018842 | 0.012402 | 0.074783*** | 0.049223 | 0.055597*** | 0.036594 |
| sdWater PMS | 0.017949*** | 0.01017 | 0.07124*** | 0.040365 | 0.052963 | 0.030009 |
| sdWaste PMS | 0.012561*** | 0.005133 | 0.049855*** | 0.020372 | 0.037064** | 0.015146 |
| sdBill | 0.015271*** | 0.015973 | 0.060611*** | 0.063395 | 0.045061 | 0.04713 |
| Log likelihood function | -684.304 | -704.741 | -1502.402 | |||
| McFadden Pseudo R2 | 0.398651 | 0.434326 | 0.406422 | |||
| Akaike Information Criterion | 1754.876 | 1876.900 | 4086.865 | |||
| Bayesian Information Criterion | 1890.962 | 1901.864 | 5322.083 | |||
| Number of observations | 1776 | 520 | 2296 | |||
Table 3: Estimation results on medium and large scale agro-allied preferences for improved EPMS in the study area
Source: Field survey, 2023. *** Significant at 99% confidence level; ** Significant at 95% confidence level; * Significant at 90% confidence level.
While the sign, significance and magnitude of random parameter estimates are essential when comparing empirical results, random parameter estimates themselves show the population mean. Therefore, it is also important to compare the dispersion that exists around the sample population in each experiment. This information is given by the standard deviations of the parameter distributions. Insignificant parameter estimates for derived standard deviations indicate that the dispersion around the mean is statistically equal to zero, suggesting that all information in the distribution is captured within the mean [13]. On the other hand, significant parameter estimates for derived standard deviations of a random parameter suggest the existence of heterogeneity in the parameter estimates over the sampled population around the mean parameter estimate. According to Efobi et al. [13], this implies that different individuals possess individual-specific parameter estimates that may be different from the sample population mean parameter estimate.
In terms of the standard deviations of random parameters, the result show that the pooled M&LSAAI model had more estimates that were statistically insignificant than the other two models. Only three attribute parameters in the pooled M&LSAAI model (noise PMS, air PMS and waste PMS) had significant standard deviations. In the MSAAI model, all estimates except for air PMS were significant; while in the LSAAI model, all estimates were significant. This suggests that in the MSAAI and the LSAAI models, different respondents possessed individual- specific parameter estimates that may be different from the sample population mean parameter estimate. However, in the pooled M&LSAAI model, the dispersion around the mean of most estimates is statistically equal to zero, suggesting that all information in the distribution is captured within the mean. This implies that the pooled M&LSAAI experiment was able to capture the true preferences of respondents better than the other experiments.
Extended MNL model result of Socio-economic factors influencing M&LSAAI preferences for improved pollution management technology options
The second multinomial logit model (the extended model) is a multinomial logit model estimated by including various socioeconomic and demographic variables together with the attributes in the basic model. These variables are iterated with the alternative specific constant (ASC) to accommodate for heterogeneity of preferences. Table 4 shows the results of the extended model. The inclusion of the socioeconomic variables in the basic model has improved the overall fit of the model.
Hypothesis and post estimation tests
Initially, it was hypothesized that socio-economic factors have no significant effect on M&LSAAI preferences for improved environmental pollution management technology options. However, the analysis revealed that socio- economic predictors had significantly influence preferences for improved environmental pollution management technology options. This was justified by the Prob (LR statistic) which is the probability value that indicates the statistical significance of the LR statistic of three multinomial logistic regression models (medium and large scale agro-allied industries and pooled M&LSAAI) which were both significant at the 1% significant level (P<0.05). Consequently, the null hypothesis was rejected and the alternate hypothesis accepted. The estimation of the multinomial logit model was preceded by diagnostic tests for multicollinearity, heteroscedasticity, normality assumption, goodness of fit and independence from irrelevant alternatives (IIA). The results for these tests are described as follows.
Testing for multicollinearity: Results obtained for a Variance inflation factor (VIF) test showed that there was no multicollinearity as all the variance inflation factors for all MSAAI, LSAAI and M&LSAAI were less than 10.
Test for heteroscedasticity: The Bruesch-Pagan/Cook-weisberg test for heteroscedasticity (H0) gave a χ2 (chi2) values of 17.43,12.9 and 17.40 for MSAAI, LSAAI and M&LSAAI and a p-value of 0.0000 indicating the absence of Heteroscedasticity in the data.
Test for normality: Since the kurtosis of the independent variables were equal to or less than three (leptokurtic) and most of the rest has a kurtosis of zero suggesting the data approximates normal distribution.
Assessing Goodness of fit of the multinomial logit model: The reduced log-likelihood and increased McFadden R-squared in Table 4 demonstrate the model’s goodness of fit. The McFadden’s R squared values of 0.478200, 0.516340 and 0.642340 indicates good model fit for MSAAI, LSAAI and M&LSAAI respectively.
Tests for independence from irrelevant alternatives (IIA): The Hausman test conducted in the study to assess the IIA assumptions indicated no evidence to reject the null hypothesis, confirming that the study adhered to the IIA assumptions.
The result of the extended multinomial logistic regression model gave a log likelihood ratio (LR) statistic of -537.110, -628.368 and -312.142 for MSAAI, LSAAI and pooled M&LSAAIs and were significant at the 1% level of probability respectively, an indication that the explanatory variables included in the model jointly explained the variations in preferences for improved EPMS in the study area. In the Akaike Information Criterion (AIC) which are often used to choose between competing models, the lower the value of these criteria, the better the model is. From this example, the Akaike info criterion (AIC) Figures of 1.273414, 1.285688 and 1.415234 is less than two across MSAAI, LSAAI and pooled M&LSAAI experiments respectively and therefore indicates that it is the best model to adopt in this case. In the result, the coefficients for the age of the respondent is significant and negative for MSAAI at 1% (while it is positively significant for LSAAI at 5%). The negative sign signifies that older medium scale agro-allied industry managers may be reluctant to changes from their familiar environment thereby potentially reducing their willingness to pay for enhancements in EPMS. Conversely, the positive coefficient for large scale agro-allied industries conforms to a priori expectation which could be explained by the fact that as people get older; they tend to understand the importance of maintaining a clean environment. It is expected that older industrialist may be more naturally conscious of their environment and would do anything to maintain it. The result implies that as age of LSAAI increases, the more likely they are going to prefer better environmental pollution management option which ardently increases their willingness to pay. The marginal effects of age (-0.082422 and 0.063944) shows that a unit increase in their respective ages would decrease the WTP among MSAAI by 8.2% and increase the WTP among LSAAI by 6.4%. This contradicts the previous study of [3] which states that age has no significant effect on preference for improved poultry waste management options. However, this result confirms the study by Ayoola et al. [6]. In agreement with, Ayoola et al. [7] opined that older industry managers are considered better environmental managers in the sense that they are rational decision makers and have established reputation in the community on proper management of natural resources.
The coefficient of the variable level of education of the respondent is positive and significant at 1% for medium scale agro-allied industries implying that medium scale industry managers with more years of education favour the improvements in EPMS. Given that educated people typically possess a greater depth of awareness as compared to those with lower levels of education, this result is in line with expectations. The positive correlation between education level and preferences for enhanced environmental practices aligns with prior assumptions. This suggests that as the educational attainment of MSAAI managers increases, they are likely to be more knowledgeable and proactive in improving environmental conditions. Consequently, individuals at higher educational levels may prioritize better EPMS to avoid potential hazardous environmental outcomes. The marginal effect (0.320266) meant that a unit increase in education of MSAAI would increase their WTP for improved EPMS by 32.0% implying that better educated MSAAI managers make reasonable environmental pollution management decisions/preferences as compared to their less educated counterparts. As individuals receive higher education, they tend to understand the need for environmental pollution management better. Studies such as [8] found out that education of agro-based industrialist had positive effect to preferences for improved solid waste management and waste separation and utilization. Furthermore, education enhances the ability of MSAAI to perceive and conceptualize environmental pollution management options by influencing the depths and richness of social networks that produce skills relating to effective contribution to a clean, safe and sustainable environment.
The size of the household is another determinant which had significant impact on WTP for improved environment pollution management attributes by LSAAI. It was negative and significant at 1% probability level. By insinuation, as the number of members in a given household increases, income diversion increases, potentials to make preferences for improved EPMS tends to reduce which distorts WTP for improved EPMS. The marginal effect of household size (0.200203) implied that increase in the household size by 1% will decrease their WTP for improved EPMS by 20.0%. This confirms the findings of Guti et al. [15] on a study on sanitation provision. On the contrary, Cicatiello et al. [10] in another study revealed that as household size increases, willingness to pay for improved service is likely to increase.
The coefficient of distance to dumpsite was positive and significantly related with the WTP for improved EPMS at 5% probability level for MSAAI and LSAAI and at the more stringent 1% level for the combined M&LSAAI group. The sign of the variable was in consonance with a priori expectations. The marginal effects of distance to dump site on WTP for improved EPMS is 0.026684, 0.039193 and 0.098372 for MSAAI, LSAAI, and M&LSAAI respectively. This implied that a 1% increase in distance to waste dump site, there would be 2.7%, 3.9% and 9.8% increase in WTP for all MSAAI, LSAAI and M&LSAAI respectively. This meant that respondents who walk longer distance to dispose-off refuse have a higher WTP than respondents who walk shorter distances. According to Guti et al. (2012), distance to waste dumping sites significantly influences preferences for improved waste management options.
This is because increase in distance complicates the problem of waste disposal as people would have to walk long distances to dispose-off their waste. Thus, they will prefer improved EPMS rather than having to cover long distances and as such will be WTP more. Monthly average income of all MSAAI, LSAAI and M&LSAAI is significant at 1% and has a positive impact on WTP for EPMS. With respect to the marginal effect, an additional unit increase in income will increase MSAAI, LSAAI and pooled M&LSAAI WTP for improved EPMS by 62.0%, 43.8%, 3.5% respectively. This is consistent with economic theory that indicates that income is positively correlated with demand in general and the same with environmental demand. This also indicated that environmental good is a normal good since its demand increases with income and this is in conformity with the study by Mariel et al. [21] that increased income would place the industrialist on a good pedestal for higher levels of business that would warrant the industrialist to be more environmentally conscious. Moreover, the industrialist’ business ingenuity and the concomitant drive for innovations necessitate the adoption of superior environmentally friendly technologies.
|
Attributes |
MSAAI | LSAAI | POOLED M&LSAAI | ||||||
|
Coefficient |
Std. Error |
Marginal effect (ẟy/dx) |
Coefficient |
Std. Error |
Marginal effect (ẟy/ dx) |
Coefficient |
Std. Error |
Marginal effect (ẟy/ dx) | |
| ASC | 0.402750*** | 0.05405 | 0.45090 | 0.003940*** | 0.417461 | 0.461497 | 0.904580*** | 0.365754 | 0.037307 |
| ASC*Age | -0.000457*** | 0.005551 | -0.082422 | 0.934332** | 0.00839 | 0.063944 | 0.131201 | 0.895632 | 0.091354 |
| ASC*Gender | -0.047317 | 0.013302 | -0.557201 | 0.000423 | 0.266783 | 0.111023 | -2.402959 | 0.016364 | 0.001669 |
| ASC*Marital status | -0.015129 | 0.009857 | -0.534851 | 0.124821 | 0.061869 | 0.083301 | -0.742719 | 0.457793 | 0.046695 |
| ASC*Educational level | 0.004694*** | 0.003555 | 0.320266 | 0.186721 | 0.008600 | 0.029638 | 0.290150 | 0.771712 | 0.078715 |
| ASC*Satisfied with
status quo |
0.001842 | 0.002109 | 0.873132 | 0.382612 | 0.006778 | 0.017659 | 0.383820 | 0.701134 | 0.071516 |
| ASC*Monthly Income
month |
6247.410*** | 0.004573 | 0.620300 | 9049.212*** | 0.036716 | 0.4384928 | 0.9538.66*** | 0.340256 | 0.034706 |
| ASC*Distance to dump- site | 0.000122** | 0.004565 | 0.026684 | 0.978787** | 0.001751 | 0.039193 | 0.044669*** | 0.964433 | 0.098372 |
| ASC*Awareness of PMS | 0.001376 | 0.001734 | 0.793471 | 0.427598 | 0.003602 | 0.014577 | 0.247117 | 0.804867 | 0.082096 |
| ASC*Number of em- ployees | -0.001650 | 0.003388 | -0.486991 | 0.626376 | 0.009664 | 0.052580 | 0.183796 | 0.854222 | 0.087131 |
| ASC*Membership in
Association |
-0.027091 | 0.017002 | -0.593370 | 0.111189 | 0.114164 | 0.135043 | -0.845390 | 0.397912 | 0.040587 |
| ASC*Formal training
on EPC |
0.005627 | 0.005113 | 1.100353 | 0.271276 | 0.029613 | 0.043082 | 0.687369 | 0.491809 | 0.050165 |
| ACS*Distance to resi- dential buildings | -0.002826 | 0.003355 | -0.842445 | 0.399578 | 0.008028 | 0.027717 | -0.289659 | 0.772109 | 0.078755 |
| ASC*Exposure to mass
media on EPC |
0.003304 | 0.004067 | 0.812405 | 0.416699 | 0.013887 | 0.033924 | 0.409349 | 0.682344 | 0.069599 |
| ASC*Industrial Expe- rience | -0.116449 | 0.027239 | -0.275139 | 0.039212 | 0.458573 | 0.244630 | -1.874557 | 0.060923 | 0.006214 |
| ASC*Household Size | -0.009549 | 0.008643 | -0.104767 | -0.269331*** | 0.201290 | -0.200203 | 0.200112 | 0.920111 | 0.093851 |
| Log | Log L | AIC= | Log L=- | AIC = | Log L=-* | AIC = | |||
| Likelihood/AIC | =-537.110*** | 1.273414 | 628.368*** | 1.285688 | 312.142** | 1.415235 | |||
| McFadden R squared | 0.478200 | 0.516340 | 0.642340 | ||||||
Table 4: Socio-economic factors influencing M&LSAAI preferences for improved pollution management technology options
Source: Field survey, 2023. *** Significant at 1%; ** Significant at 5%; * Significant at 10%
Reasons for not having efficient environmental management strategies among medium and large scale agro-allied industries
The result in Figure 2 elicited the possible reasons for not having efficient environmental management strategies among medium and large scale agro-allied industries. Although, there could be various factors contributing to this, respondents were asked to choose from the following viz: financial constraint, lack of awareness, absence of necessary infrastructure, perceived insignificance and concerns over profitability. The word ‘efficient’ was specific to improved EPMS/technologies. The study found out that the major reason for not having the efficient environmental pollution management strategies among an average proportion of 52.3%, 43.1% and 50.2% of MSAAI, LSAAI and pooled M&LSAAI respectively is not knowing about the improved environmental pollution management strategies. Equally, MSAAI (9.5%), LSAAI (6.2%) and M&LSAAI (8.2%) who do not have the infrastructure to install certain technologies are likely to ignore the technology. Another reason for not having improved EPMS is that respondents cannot afford the technology.
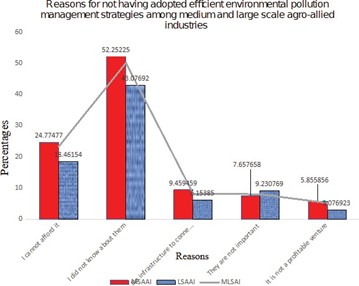
Figure 2: Reasons for not having efficient environmental management strategies among medium and large scale agro-allied industries. (Source: Field survey, 2023).
Conclusion and Recommendations
The study concluded that the pooled M&LSAAI experiment were willing to pay 13.3% of the national minimum wage of ₦30,000 (₦4,000.00) for improved noise PMS, water PMS and waste PMS and that age, level of education, distance to dumpsite and monthly average income influenced the preferences of both M&LSAAI for improved environmental management technologies. To this end, the primary step should be identifying and promoting income generating programmes and upgrade the education level of the M&LSAAI managers by the state government through the states waste management agency. Moreover, the states waste management agency may create awareness and teach industry managers about the benefits of improved environmental pollution management technologies. Furthermore, the state’s waste management agency should prioritize raising awareness among industry managers about the advantages and importance of adopting improved environmental pollution management technologies. By educating and empowering M&LSAAI entities, as well as fostering a supportive environment for sustainable practices, significant strides can be made towards enhancing environmental sustainability within the sector.
References
1. Adepoju, A. O., Yusuf, S. A., Omonona, B. T & Okunmadewa, F. Y. (2011). Vulnerability Profile of Rural Households in South West Nigeria. Journal of Agricultural Science.
2. Afroz, R.; Hassan, M.; & Ibrahim, N. (2003). Willingness to pay for air quality improvements in Klang Valley Malaysia. Am. J. Environ. Sci. 1(3): 194-201.
3. Aguayo, F., Gallagher, P., & Gohzalez, A. (2001). Dirt is in the eye of the beholder: The World Bank air pollution intensities for Mexico. Global development and environment institute working paper: 1 (7). www.intechopen
4. Akinsanya, C.K. (2003). Recent trends in the pollution load on the Lagos Lagoon. – Lagos state perspective. (A paper presented on ecological sustainable industrial development workshop organized by UNIDO).
5. Alharthi, M., Hanif, I., & Alamoudi, H. (2022). Impact of environmental pollution on human health and financial status of households in MENA countries: Future of using renewable energy to eliminate the environmental pollution. Renewable Energy, 190, 338–346. https://doi.org/10.1016/j.renene.2022.03.118
6. Arimah, B.C & Adinnu, I.F (1995). “Market Segmentation and the Impact of Landfills on Residential Property Values: Empirical Evidence from an African City”. Netherlands Journal of Housing and the BuiltEnvironment:10 (2), pp. 157-170.
7. Ayoola, P.B, Adekeye, E.A & Jakanola, O.O (2012). Environmental Pollution and Control within Sabo Area of Ogbomoso in Oyo State of Nigeria. IJRRAS 10 (2):329-338
8. Azodo, A.P., Ismaila, S.O., & Owoeye, F.T. (2018). Investigation of occupational noise exposure and its physiological effect on landscape gardeners. Proceedings of the 2018 International Conference on SET: A driving force for sustainable development tagged COLENG 2021, Federal University of Agriculture, Abeokuta, Nigeria.
9. Bennett, J. & Blamey, R. (2001). The Choice Modelling Approach to Environmental Valuation, Edward Elgar Publishing Inc., Cheltenham, UK.
10. Cicatiello, L., Ercolano, S., Gaeta, G. L., & Pinto, M. (2020). Willingness to pay for environmental protection and the importance of pollutant industries in the regional economy. Evidence from Italy. Ecological Economics, 177, 106774106774. https://doi.org/10.1016/j.ecolecon.2020.106774
11. Combes, J., Hamit-Haggar, M., & Schwartz, S. (2018). A multilevel analysis of the determinants of willingness to pay to prevent environmental pollution across countries. The Social Science Journal, 55(3), 284–299. https://doi.org/10.1016/j. soscij.2018.02.001
12. Efobi, U., Belmondo, T., Orkoh, E., Atata, S. N., Akınyemi, O., & Beecroft, I. (2018). Environmental pollution policy of small businesses in Nigeria and Ghana: extent and impact. Environmental Science and Pollution Research, 26(3), 2882–2897. https://doi.org/10.1007/s11356-018-3817-x
13. Efobi, U.R, Belmondo, T., Orkoh, E., Atata, S.N., Akinyemi, O & Beecroft, I. (2018). Environmental pollution policy of small businesses in Nigeria and Ghana: Extent and impact, AGDI Working Paper, No. WP/18/050, African Governance and Development Institute (AGDI), Yaoundé.
14. Gbadegesin, A., (2000), The Impact of Oil Exploration and Production Activates. International Food Policy Research Institute (IFPRI).
15. Guti, B., Aji, M.M. & Magaji, G. (2012): Environmental impact of natural resources exploitation in Nigeria and the way forward. Journal of Applied technology in Environmental Sanitation. Vol. 2: 2 pp: 95-102.
16. Hanley, N., Mourato, S. and Wright, R. E. (2001). Choice modelling approaches: a superior alternative for environmental valuatioin? Journal of Economic Surveys, 15, 435-462.
17. Hensher, D. A., Rose, J. M. & Greene, W. H. (2015). Applied Choice Analysis, Cambridge University Press.
18. Igwe, P.U., Chukwudi, C.C., Ifenatuorah, F.C., Fagbeja, I.F., & Okeke, C.A. (2017). A Review of Environmental Effects of Surface Water Pollution. International Journal of Advanced Engineering Research and Science (IJAERS) [Vol-4, Issue-12, Dec- 2017] https://dx.doi.org/10.22161/ijaers.4.12.21 ISSN: 2349-6495(P) | 2456-1908(O)
19. Li, X., Cai, J., Wang, Q., & Wang, X. (2022). Heterogeneous public preferences for controlling agricultural non-point source pollution based on a choice experiment. Journal of Environmental Management, 305, 114413–114413. https://doi.org/10.1016/j.jenvman.2021.114413
20. Magbagbeola N.O, (2001). The Use of Economic Instruments for industrial pollution management in Nigeria: Application to the Lagos Lagoon”. In Natural Resources use, the environment and sustainable development. Nigeria Economic society, University of Ibadan, Ibadan, Nigeria. Pp 535-556.
21. Mariel, P., Khan, A. M., & Meyerhoff, J. (2022). Valuing individuals’ preferences for air quality improvement: Evidence from a discrete choice experiment in South Delhi. Economic Analysis and Policy, 74, 432–447. https://doi.org/10.1016/j.eap.2022.03.006
22. Mu, L., Mou, M., Tang, H., & Sheng-rong, G. (2023). Exploring preference and willingness for rural water pollution control: A choice experiment approach incorporating extended theory of planned behaviour. Journal of Environmental Management, 332, 117408–117408. https://doi.org/10.1016/j.jenvman.2023.117408
23. Ogedengbe, P.S. & Onyuanyi N. (2017). Effect of Industrial Pollution on Residential Neighbourhood: Amuwo Odofin Industrial Layout Lagos as Case Study. Covenant Journal of Research in the Built Environment (CJRBE): 5(1), June 2017.
24. Ogungbuyi, O.M. & Osho, Y.B. (2005). Study on Industrial Discharges to the Lagos Lagoon. Report Submitted by United Nations Industrial Development Organization (UNIDO), Country Service Framework Programme under the Ecological Sustainable Industrial Development Programme.
25. Oketola, A.A., & Osibanjo, O. (2007). Estimating sectoral pollution load in Lagos by Industrial Pollution Projection System (IPPS): Employment versus Output. Toxicological & Environmental Chemistry. 91, (5), 799-818.
26. Organisation for Economic Co-operation and Development (OECD), (2019). Recommendation of the Council concerning the application of the polluter-pays principle to accidental pollution, C (74) 223
27. Sridhar M.K.C, Coker A.O., Achi C. (2018). Pollution from Small and Medium Size Enterprises: Less Understood and Neglected Sources in Nigerian Environment. J Environ Anal Toxicol 8: 558. DOI: 10.4172/2161-0525.1000558.
28. Ude K. D, Osuafor O.O & Ofoha D.C (2022). Awareness, attitude and behavioural intention of medium and large-scale poultry producers to poultry waste management practices in Lagos State: a principal component analysis. NASS journal of agricultural science. Volume 4. DOI: http:/dx.doi.org/10.36956/njas.v4il.472
29. Ude, K.D. (2017). Analysis of the preference for improved poultry waste management technique among medium and large-scale poultry industries in Lagos state, Nigeria. An unpublished master’s dissertation, University of Nigeria, Nsukka.
30. United Nations Environmental Programme (UNEP), (2021). Environmental Survey of Ogoniland Nigeria” Project Document for UNDP, 3-4.
31. Ye, F.-F., Yang, L.-H., Wang, Y., & Chen, L. (2020). An environmental pollution management method based on extended belief rule base and data envelopment analysis under interval uncertainty. Computers & Industrial Engineering, 144, 106454–106454. https://doi.org/10.1016/j.cie.2020.106454
32. Zhang, S., Yang, B., & Sun, C. (2022). Can payment vehicle influence public willingness to pay for environmental pollution control? Evidence from the CVM survey and PSM method of China. Journal of Cleaner Production, 365, 132648–132648. https://doi.org/10.1016/j.jclepro.2022.132648
This article licensed under the Creative Commons Attribution 4.0 International License CC-BY 4.0., which permits unrestricted use, distribution, and reproduction in any medium, provided the original author and source are properly credited.