
NL Journal of Medical and Pharmaceutical Sciences
(ISSN: 3108-0502)
Cognitive Functions and the Modern Neurophysiological Methods as the Optimal System of Training Students Choosing
Author(s) : Gulyaev SA*, Borodulina OG, Kalaiselvi K, Srivignesh P, Mohammed FF, Hussen VHM, Dubov LYu, Khanukhova LM, Garmash AA. DOI : 10.71168/NMP.01.02.112
Abstract
Modern higher education is a complex process that directly affects the cognitive abilities of an indi- vidual. Obtaining higher education is one of the global tasks of any state, since it is people who have received higher education who determine the strategy of its development. However, higher education itself needs objec- tive methods for assessing the capabilities of students in order to develop the most optimal programs for their training. In the presented work, an attempt was made to consider the possibilities of modern neuroscience within the framework of freely available neurophysiological methods of non-invasive diagnostics, which can be applied to the objectification of the cognitive profile of individuals receiving higher education. The work considered both methods of direct observation of the power of rhythmic activity of known cortical formations and a modern method of studying EEG - microstates, which allows characterizing the general work of cerebral structures during the implementation of cognitive function. The proposed methods, introduced into the examination complexes of applicants and students, can help in their profiling and choosing the optimal system of teaching disciplines at the stage of obtaining higher education. Key words: Cognitive processes, mirror neurons, EEG microstates, neurophysiology of healthy people, solving cognitive problems, brain mapping.
Introduction
Obtaining higher education is one of the global tasks of any state, since it is people who have received higher education who determine the strategy of its development. However, higher education itself needs objective methods for assessing students’ capabilities in order to develop the most optimal programs for their training. A.R. Luria back in the 70s of the last century [1] linked the thought process with individual functional and structural areas of the cerebral cortex and, relying on factor analysis, identified several types of intellectual process disorders. However, the development of technologies of that time did not allow the creation of an objective system confirming medical observations. At the end of the last century, thanks to the rapid development of medical technologies, new theories and methodological developments appeared that make it possible to implement the ideas of A.R. Luria at a new stage in the development of neuroscience with the formation of new objective technologies for assessing human thinking. These are the opportunities that are necessary for modern higher education to develop new and effective training programs. Nevertheless, the main difficulty of objective research is the impossibility of conducting direct invasive studies in humans due to the position of cerebral structures inside the skull. When organizing an experiment on animals, this limitation can be circumvented by using invasive electrode systems, but in healthy people (and especially in the case of studying cognitive function), such methods are not used for ethical and medical reasons, and cases when invasive research of neural activity in people becomes possible are mainly associated with studies of pathological conditions with complex pathogenetic mechanisms, therefore, they do not represent a convincing model of a healthy brain.
Therefore, modern scalp electroencephalography (EEG), including a powerful system of mathematical processing, allows observing changes in the functional activity of neural structures with a high degree of temporal resolution, almost in real time. Of the presented methods, EEG is a fairly simple and accessible method for the researcher to study the functional activity of brain structures, the advantage of which is to obtain direct information about the state of the neural connection system. The introduction of modern methods of mathematical signal processing has made it possible to overcome the shortcomings of the classical technique to a certain extent and bring the accuracy of the method closer to the level of neuroimaging methods. What systems and technologies require special attention in the objectification of cognitive functions? Mirror Neuron System Currently, the mirror neuron system is considered to be the basis of human learning based on teacher-student interaction. This effect was first described in the early 1990s by Italian neurophysiologists Giacomo Rizzolatti and his colleagues, based on changes in the activity of the premotor cortex of macaques not only when the animal performs a certain action, but also when observing a similar action performed by another animal [2]. This discovery gave rise to the hypothesis that similar cells are present in humans, responsible for understanding the actions, intentions, emotions of other people and imitative behavior. The mirror neuron hypothesis is interesting primarily because it allows us to explain the mechanisms of inclusion of an individual in society, which attracts the attention of researchers both in the section of normal physiology of brain structures and in the context of its pathological changes. For example, imitation learning using a mirroring system is used to correct social skills in patients with autism spectrum disorders and to restore motor functions after the development of acute cerebrovascular accident, where an improvement in motor capabilities is noted [3,4] Also, an important place among therapeutic methods is occupied by mental training, consisting of mental repetition of movements, which is used to improve motor control in Parkinson’s disease [5] and post-stroke rehabilitation [6-8] One of the putative neurophysiological markers of mirror activity in humans is the mu rhythm (8-13 Hz) in the sensorimotor cortex, first described by A. Gasto in 1954 [9]. According to modern studies, the presence of the mu rhythm is associated with the functioning of the mirror system, as evidenced by its reduction with age along with a decrease in the degree of manifestation of imitative behavior. But the results of the studies are contradictory: in some works the correlation between mu- suppression and observation is confirmed, in others such a connection is not found [10-13] EEG - microstates as a reflection of the activity of individual neural networks. In 1998, this phenomenon attracted the attention of D. Lehmman, studying individual variants of changes in EEG maps, he came to the conclusion that the bioelectrical activity of the brain can be represented by a repeating sequence the activity of individual and fixed in time patterns of distribution of biopotentials on the scalp surface of the head [14,15] Their duration is about 40-120 ms, and the source is individual neural pools demonstrating synchronous activity. Further study of the phenomenon of EEG microstates showed that four configurations are most often repeated in healthy subjects, which made it possible to define them as separate classes of EEG microstates and to link their activity with the structures of passive brain function. [16-19] Solving the inverse EEG problem as a basis for linking functional activity with known anatomical structures of the brain. The main characteristics of EEG microstates allow us to evaluate the structural and functional organization of large neural networks of the brain, but to take into account the spatial characteristics of cerebral activity, EEG data must be subjected to the so-called solution of the inverse problem. One of the solutions to this problem was the development of R.D. Pascual-Marqui software package for EEG signal analysis with the ability to solve the inverse EEG problem, called Low Resolution Electromagnetic Tomography (LORETA) [20]. With the addition in 1999 of quantitative neuroanatomy based on templates provided by the Brain Imaging Center of the Montreal Neurological Institute (MNI), LORETA technology reached a level comparable to classical functional imaging methods such as PET and fMRI [21,22].
The aim of the study was to determine the possibility of using currently known technologies for neurophysiological examination of the bioelectrical activity of the brain for the prospective development of a method for analyzing the mental characteristics of relatively healthy people to be able to select the optimal model for their training.
Materials and Methods
The study involved 41 people, MEPhI students aged 18 to 25, who voluntarily expressed a desire to participate in the experiment. The average age of the subjects was 21 years ± 1.3 years (minimum - 18 years, maximum - 26 years, mode - 21 years, median - 21 years). The age distribution characteristics are normal (Kolmogorov-Smirnov test p < 0.01).
The inclusion criteria were voluntary consent to the study, current full-time education at MEPhI and understand- ing of the goals and objectives of the study.
The exclusion criteria were voluntary refusal to complete tasks, refusal to participate in the experiment, physical and psycho-emotional exhaustion, taking psychoactive drugs during the experiment, including those prescribed by a doctor.
The exclusion criteria were the development of acute respiratory viral infections during the study and failure to follow the instructor’s commands. Cognitive status was assessed using a battery of tests from the Federal Center for Brain and Neurotechnology of the Federal Medical and Biological Agency of Russia. The following tests were used: “Memory”, “Recognition”, “Praxis”, “Attention”, “Thinking”, presented in the form of a computer program with free external access via the Internet [23].
At the next stage of the experiment, all subjects underwent an EEG study of the mu-activity of the brain under conditions of passive relaxed wakefulness with open eyes and during the test load. A 19-channel interface was used according to the “10-20” system with a common average-weighted electrode to exclude distortions of the EEG signal arising from the difference in distances between the active and reference electrodes. In order to sup- press alpha activity, all studies were conducted with the eyes open, which allowed us to suppress the alpha activ- ity of the 17th, 18th, 19th, 29th, 30th and 31st Brodmann areas, which are the cortical centers of the visual and retrosplenial systems of the brain, as well as the parietal structures related to the tertiary centers of the cortex.
The mu-range of EEG frequencies was isolated using a narrow-band signal filtering system between frequen- cies of 9 Hz and 15 Hz. The localization characteristics of the mu-rhythm were determined using a two-dimen- sional map based on frequency analysis of the signal using the fast Fourier transform (FFT) method using the EDF-browser software product, which has a free, open-source license, and is controlled by the freely distributed GNU/Linux system. The criterion for detecting mu-activity was the recording of a rhythmic signal under the C3 and C4 electrodes, since these electrodes are located directly above the Rolandic region and most effectively re- cord the mu-range signal. The frequency of the selected signal was recorded and subsequent studies of changes in signal power were conducted only at this frequency.
Rhythmic clenching and unclenching of the hands was chosen as a motor test, since the hand has the greatest representation in the motor cortex and they are most distant from each other in space, which avoids distortion of the studied signal due to its summation and superposition.
The first test is active movement of the hands for three minutes, the second is observation of the instructor per- forming similar actions.
EEG microstates are limited and stable changes in scalp potential representing the work of individual neural net- works of the brain. In our study, we analyzed 8 unique classes of EEG microstates, including both 4 classical and 4 additional ones. The following indicators were studied: the percentage of the contribution of MC to the total SPC (average values); the frequency of occurrence of one class of MC in 1 sec (average values) and the lifetime of one microstate in sec. The selection of individual EEG classes - microstates, was an automatic procedure for process- ing the EEG signal (previously subjected to procedures for removing artifact activity), based on the technology of clustering given signal types, implemented on the sLORETA v.20210701 application package, The KEY Institute for Brain-Mind Research, Univ Zurich, Switzerland.
The solution of the inverse EEG problem for each EEG class - microstates was also carried out by mathematical- ly solving the problem of determining the localization of the dipole in a three-dimensional model of the head, limited by 3 types of tissue and excluding solutions that go beyond the presented model. All calculations were performed using an automatic tool from the sLORETA v.20210701 package, The KEY Institute for Brain-Mind Research, Univ Zurich, Switzerland, which excluded the influence of the human factor on the result. Statistical processing of the results was performed using the PSPP software product (GNU PSPP version 1.6.2-g78a33a, software for statistical analysis. Copyright © 1997, 1998, 2004, 2005, 2009, 2012, 2013, 2014, 2016, 2019, 2020 Free Software Foundation, Inc), running the freely distributed GNU/Linux system.
Results
The study revealed statistically significant suppression of the mu rhythm both during active movement performance (change in average power from 0.76 to 0.30 μV² in C3 and from 0.59 to 0.19 μV² in C4, p<0.001) and during observation of the instructor (up to 0.29 μV² in C3 and 0.27 μV² in C4, p=0.003). There was no statistically significant difference between the change in mu activity during active movement and during movement observation (p=0.9) (Table 1).
Table 1: Changes in mean mu rhythm power during motor tasks and their comparative statistics (paired Student’s t-test)
| Position | Rest Test (мкВ²) | Active movement (мкВ²) | Observation (мкВ²) | Rest test | Active movement | Observation |
| С3 | 0,76 | 0,30 | 0,29 | p<0,001 | p=0,003 | p=0,9 |
| С4 | 0,59 | 0,19 | 0,27 | p<0,001 | p=0,001 | p=0,2 |
Table 2: Changes in mean mu rhythm power with gender division and their comparative statistics (paired Student’s t-test)
| Group | Position | Rest (мкВ²) | Active movement (мкВ²) | Observation (мкВ²) | Rest Active movement | Rest Observation | Active movement Observation |
| M | С3 | 0,83 | 0,34 | 0,37 | 0,01 | 0,04 | 0,1 |
| M | С4 | 0,57 | 0,17 | 0,34 | 0,9 | 1 | 0,6 |
| F | С3 | 0,67 | 0,25 | 0,19 | 0,01 | 0,03 | 0,5 |
| F | С4 | 0,62 | 0,21 | 0,17 | 0,02 | 0,01 | 0,4 |
However, division of the main group depending on the results of the cognitive test (Table 3) revealed the following: in group I (high results), a reliable change in mu-activity was recorded only in the right hemisphere of the brain during both tests, while in the left, reliable changes in power were recorded only when performing the test with active movement; in group II (average results), reliable changes in the power of the mu-rhythm were noted in both hemispheres; in group III (low results), there was no reliable change in the power of the mu-rhythm, both during observation and during active movement (Table 4).
Table 3: Mean scores of cognitive testing
| Group | Memory | Recognition | Praxis | Attention | Thinking | Mean |
| I | 4,4 | 5,0 | 5,0 | 4,7 | 4,7 | 4,8 |
| II | 3,1 | 4,8 | 4,7 | 3,6 | 4,3 | 4,1 |
| III | 1,6 | 4,3 | 3,6 | 0,8 | 3,8 | 2,8 |
Table 4: Changes in mean mu rhythm power by cognitive performance group and their comparative statistics (paired Student’s t-test)
% contribution of MS to the total SCP (average values)
| Group | Test | С3 (мкВ²) | С4 (мкВ²) | Rest – Active movement | Rest - Observation | Active movement - Observation | |||
|
I (high results) |
Rest | 0,9 | 0,8 | С3 | С4 | С3 | С4 | С3 | С4 |
| Active movement | 0,3 | 0,2 | |||||||
|
p<0,01 |
p=0,02 |
p=0,1 |
p=0,06 |
p=0,6 |
p=0,2 |
||||
| Observation | 0,2 | 0,3 | |||||||
|
II (middle results) |
Rest | 0,9 | 0,8 |
p=0,02 |
p=0,03 |
p=0,01 |
p=0,02 |
p=0,3 |
p=0,8 |
| Active movement | 0,4 | 0,3 | |||||||
| Observation | 0,2 | 0,3 | |||||||
|
III (low results) |
Rest | 0,6 | 0,5 |
p=0,3 |
p=0,2 |
p=0,04 |
p=0,4 |
p=0,8 |
p=0,4 |
| Active movement | 0,2 | 0,2 | |||||||
| Observation | 0,3 | 0,3 | |||||||
Characteristics of indicators of individual EEG classes - microstates
Below are the average values for the selected individual 8 EEG classes - microstates obtained during the experiment for three observation groups, selected depending on the performance of the cognitive test.
Table 5: Characteristics of changes in the main indicators of individual EEG classes microstates in the examined groups (I - III)
| I Group | I | II | III | IV | V | VI | VII | VIII |
| Rest | 0,13 | 0,12 | 0,09 | 0,12 | 0,11 | 0,17 | 0,14 | 0,12 |
| Active movement | 0,13 | 0,11 | 0,13 | 0,12 | 0,12 | 0,14 | 0,13 | 0,11 |
| Observation | 0,13 | 0,13 | 0,12 | 0,12 | 0,12 | 0,13 | 0,11 | 0,14 |
| II Group | I | II | III | IV | V | VI | VII | VIII |
| Rest | 0,12 | 0,12 | 0,13 | 0,14 | 0,12 | 0,12 | 0,12 | 0,12 |
| Active movement | 0,11 | 0,13 | 0,12 | 0,13 | 0,12 | 0,12 | 0,12 | 0,15 |
| Observation | 0,13 | 0,12 | 0,13 | 0,13 | 0,12 | 0,13 | 0,11 | 0,14 |
| III Group | I | II | III | IV | V | VI | VII | VIII |
| Rest | 0,12 | 0,15 | 0,13 | 0,10 | 0,13 | 0,10 | 0,15 | 0,14 |
| Active movement | 0,13 | 0,12 | 0,12 | 0,12 | 0,13 | 0,13 | 0,13 | 0,13 |
| Observation | 0,12 | 0,13 | 0,12 | 0,12 | 0,11 | 0,14 | 0,13 | 0,12 |
|
Frequency of occurrence of one class of MS in 1 sec (average values) |
||||||||
| I Group | I | II | III | IV | V | VI | VII | VIII |
| Rest | 2,30 | 2,22 | 1,98 | 2,18 | 2,20 | 2,45 | 2,31 | 2,37 |
| Active movement | 2,38 | 2,27 | 2,44 | 2,09 | 2,35 | 2,51 | 2,35 | 2,15 |
| Observation | 2,14 | 2,09 | 1,91 | 2,13 | 2,28 | 2,13 | 2,17 | 2,32 |
| II Group | I | II | III | IV | V | VI | VII | VIII |
| Rest | 2,21 | 2,03 | 2,23 | 2,38 | 2,13 | 2,19 | 2,22 | 2,12 |
| Active movement | 1,81 | 2,25 | 2,16 | 2,23 | 2,07 | 2,20 | 2,01 | 2,31 |
| Observation | 2,25 | 1,96 | 2,28 | 2,40 | 2,04 | 2,29 | 1,94 | 2,29 |
| III Group | I | II | III | IV | V | VI | VII | VIII |
| Rest | 1,89 | 2,26 | 2,08 | 1,77 | 2,22 | 1,77 | 2,31 | 2,28 |
| Active movement | 2,28 | 2,22 | 2,21 | 2,19 | 2,23 | 2,25 | 2,28 | 2,29 |
| Observation | 2,15 | 2,29 | 2,21 | 2,07 | 2,07 | 2,35 | 2,23 | 2,11 |
|
Lifetime of 1 ms per sec (average values) |
||||||||
| I Group | I | II | III | IV | V | VI | VII | VIII |
| Rest | 0,06 | 0,06 | 0,06 | 0,06 | 0,06 | 0,07 | 0,07 | 0,06 |
| Active movement | 0,06 | 0,05 | 0,06 | 0,06 | 0,06 | 0,06 | 0,06 | 0,05 |
| Observation | 0,07 | 0,06 | 0,07 | 0,06 | 0,06 | 0,07 | 0,06 | 0,06 |
| II Group | I | II | III | IV | V | VI | VII | VIII |
| Rest | 0,06 | 0,06 | 0,06 | 0,06 | 0,06 | 0,06 | 0,05 | 0,06 |
| Active movement | 0,06 | 0,06 | 0,06 | 0,06 | 0,06 | 0,06 | 0,06 | 0,06 |
| III Group | I | II | III | IV | V | VI | VII | VIII |
| Rest | 0,06 | 0,06 | 0,06 | 0,06 | 0,06 | 0,06 | 0,07 | 0,06 |
| Active movement | 0,06 | 0,05 | 0,06 | 0,06 | 0,06 | 0,06 | 0,06 | 0,06 |
| Observation | 0,06 | 0,06 | 0,06 | 0,06 | 0,06 | 0,06 | 0,06 | 0,06 |
| Observation | 0,06 | 0,06 | 0,06 | 0,06 | 0,06 | 0,06 | 0,06 | 0,06 |
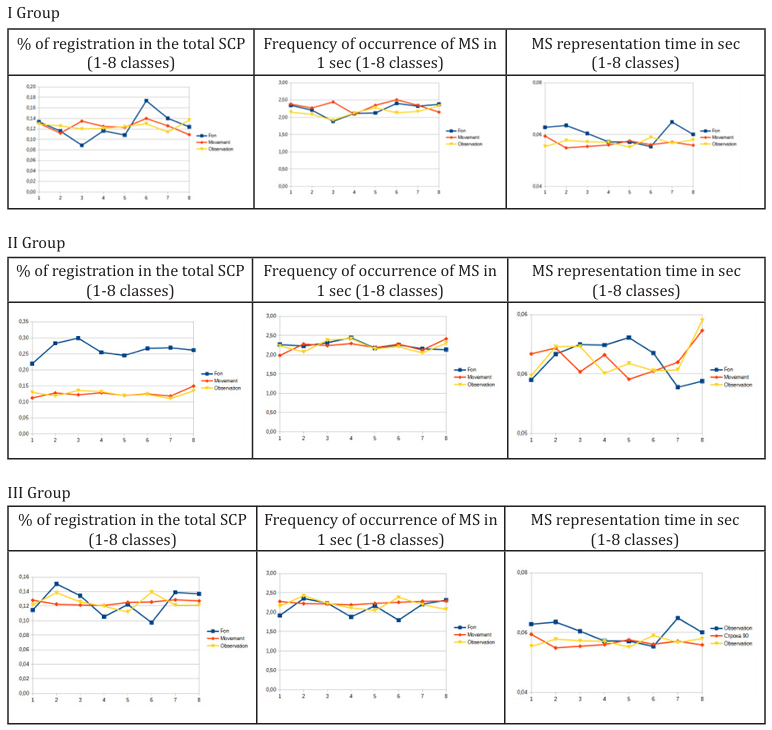 Figure 1: Graphical representation of changes in the main indicators of individual EEG classes (1-8) - microstates in the examined groups (I - III).
As can be seen from the presented, reliable changes (p<0.05) were recorded when registering the % of microstate registration in the general scalp potential and the microstate lifetime indicator. The frequency of occurrence indicator did not demonstrate statistically significant changes (p>0.05), which was an expected result, since all participants did not have established neuropsychological diseases, the nature of which could be associated with the structural pathology of individual neural networks and their connections. Group II of the examined subjects, which showed average results in testing, differed from Groups I and III in more stable % of registration in the general SCP and frequency of registration when performing the test with movement - observation. In Group I, stable indicators were noted only in the frequency of registration indicators, and in Group III, instability was noted in the background recording indicators.
Solution of the inverse EEG problem for each individual EEG microstate with the allocation of a separate neural network
Calculation of the solution of the inverse EEG problem for each class of EEG - microstates and reflection of the resulting sequence in the coordinate system Brodmann field - registration frequency, shown in the figures.
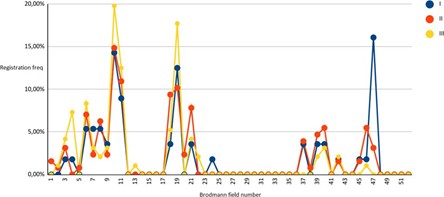 Figure 02: Solution of the inverse EEG problem in subjects (I-III groups) in a state of passive relaxed wakefulness (Background) for 52 Brodmann areas.
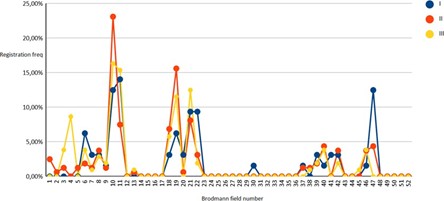 Figure 03: Solution of the inverse EEG problem in subjects (I-III groups) in a state of active test execution (Movement) for 52 Brodmann fields.
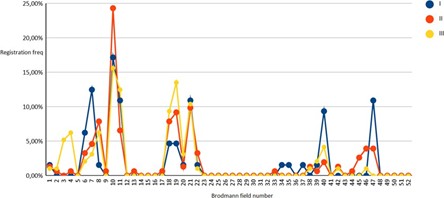
Figure 04: Solution of the inverse EEG problem in subjects (I-III groups) in the state of observing the instructor’s actions (Observation) for 52 Brodmann fields.
As can be seen from the above, in all observation groups, the results formed three main groups of solutions to the inverse EEG problem, of which the first was of greatest interest, combining Brodmann areas from the first to the eleventh, since the second and third reflected the activity of the visual (fields 17-19) and auditory (fields 21- noise perception, 39,40, 44, 45 - speech perception and speech production). Brodmann area 47 was separately considered as a general indicator of prefrontal cortex activity.
Analysis of the activity of Brodmann areas 7 and 10, reflecting the interaction of the prefrontal cortex and the structures of the tertiary cortex of the parietal, representing the center of construction and information processing, made it possible to determine that in a state of rest, the greatest activity of the cortical structures in group III of subjects was localized in Brodmann area 10, the structures responsible for the function of long-term memories. At the same time, the activity of this area in representatives of groups I and II was almost equal.
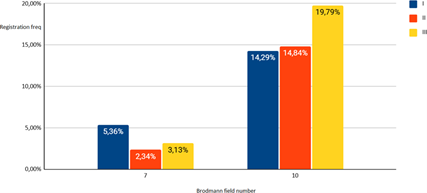 Figure 05: Solution of the inverse EEG problem in subjects (I-III groups) in a state of passive relaxed wakefulness (Background) for 10 and 7 Brodmann areas.
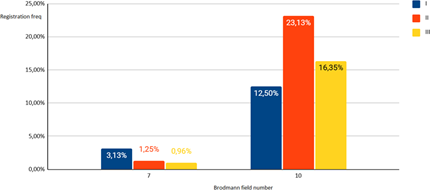 Figure 06: Solution of the inverse EEG problem in subjects (I-III groups) in the state of performing an action (movement) for 10 and 7 Brodmann areas.
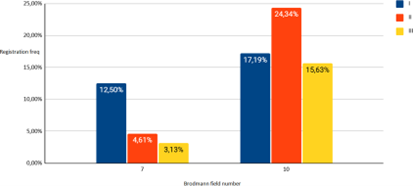 Figure 07: Solution of the inverse EEG problem in subjects (I-III groups) in the state of observing the instructor’s action (observation) for 10 and 7 Brodmann fields.
During the exercise test, the activity of the 10th Brodmann area significantly (p<0.05) increased in the representatives of the second group of subjects, while the first group showed an increase in the activity of the 7th Brodmann area (p<0.01).
Discussion
The conducted studies show the possibilities of non-invasive diagnostics in determining the cognitive capabilities of students, which can be used to determine the capabilities of students during their learning process.
A comparison of the methods used in the study shows that direct analysis of the rhythm power is a more sensitive technique for determining local changes in the characteristics of the bioelectric activity of cerebral structures. At the same time, the use of EEG microstate analysis with the solution of the inverse EEG problem is a less sensitive method due to the averaging of the indicators that arise when choosing a primary model at the stage of clustering the native EEG record. However, the main advantage of EEG microstate analysis is the direct characteristic of the activity and interaction of all cortical structures involved in the formation of the native EEG record, which allows us to evaluate the characteristics of the entire neocortex under examination, and not just its individual sections, which allows us to more fully evaluate the general cognitive process and its disorders arising from the disruption of the structure of individual neural networks. Probably, this is what was associated with the identified change in the characteristics of the activity of the prefrontal and tertiary cortex structures, identified using all the methods used in our study, which is consistent with earlier studies [24-26].
Conclusions and Suggestions
The change in the mu rhythm in the right hemisphere of the subjects of Group I, who showed excellent results in cognitive testing, as well as the increased activity of Brodmann’s area 7, revealed in them during the test, indicates that cognitively more successful students, using the systems of the right hemisphere, immediately assessed the situation and made an appropriate decision, bypassing the stages of logical analysis. Similar changes were observed [27-29] when studying the effectiveness of cognitive stimulation therapy in older people. Subjects with average test results (Group II) showed reliable changes in both hemispheres, which, in our opinion, characterized the so-called normal state of the cognitive sphere and, accordingly, the mirror neuron system, more often observed in students than the results of Groups I and III of subjects.
Thus, it was Group II of subjects that represented the main type of cognitive activity, which is the basis for the formation of student training programs, since excellent results were ensured only by the prevalence of individual cognitive mechanisms with possible basic imperfection of the main neural structures, and poor results were characterized by general functional imperfection of neural networks. Similar results can be observed in works [30-32] that also used the EEG-microstate method to analyze cognitive processes. The proposed methods, implemented in the examination complexes of applicants and students, will be able to help in their profiling and selection of the optimal system of teaching disciplines at the stage of obtaining higher education.
References
1. Luria AR. Les recherches sur le cerveau et le comportement humain [On the brain and human behavior]. Hyg Ment. 1969 Mar-Apr;58(1):1-19. French. PMID: 5376441.
2. Rizzolatti G., Sinigaglia C. Mirrors in the brain: How our minds share actions and emotions. — Oxford: Oxford University Press, 2008. — 242 p.
3. Tofani M., Santecchia L., Conte A., Carbone D., Galeoto G., Berardi A. Effects of mirror neurons-based rehabilitation techniques in hand injuries: A systematic review and meta-analysis // International Journal of Environmental Research and Public Health. — 2022. — Vol. 19, № 9. — Article 5526. — https://doi.org/ 10.3390/ijerph19095526.
4. Wang R., Li P., Qiao J., Zhang S., Wang H. The effect of mirror therapy on motor and sensory functions of the upper extremities in stroke patients: A systematic review // International Journal of Neural Systems. — 2025. — Vol. 35, No 2. — Article 2400081. — https://doi.org/ 10.1142/S0219519425400081
5. Tedeschi R., Russo M., Lombardi I., Colombo M., Magill S.T. Harnessing mirror neurons: A new frontier in Parkinson’s disease rehabilitation—A scoping review of the literature // Journal of Clinical Medicine. — 2024. — Vol. 13, No 15. — Article 4539. — https://doi.org/ 10.3390/jcm13154539].
6. Andreou M., Zouridakis S., Theodorou A. Evidence from “Broken” Mirror Neurons // Applied Sciences. — 2025. — Vol. 15, No 12. — Article 6629. — https://doi.org/ 10.3390/app15126629.
7. Bonini L., Rotunno C., Arcuri E., Gallese V. Mirror neurons 30 years later: implications and applications // Trends in Cognitive Sciences. — 2022. — Vol. 26, No 9. — P. 768–781. — https://doi.org/ 10.1016/j.tics.2022.06.003.
8. Dumas G., Moreau Q., Tognoli E. Mirror neurons are not representational: Towards convergence between enactive and neurophysiological approaches to interpersonal coordination // Philosophical Transactions of the Royal Society B: Biological Sciences. — 2020. — Vol. 375, № 1791. — Article 20190347. — https://doi.org/ 10.1098/rstb.2019.0347
9. Gastaut H.J. Etude electrocorticographique de la reactivite des rhythmes rolandiques // Revue Neurologique. — 1954. — Vol. 91, № 5. — P. 399–401. — PMID: 14398732.
10. Mitiureva D., Chorna O., Dzhala V. An inclusive paradigm to study mu-rhythm properties // International Journal of Psychophysiology. — 2023. — Vol. 187. — P. 67–78. — https://doi.org/ 10.1016/j.ijpsycho.2023.09.004.
11. Patel J. Advances in the study of mirror neurons and their impact on neuroscience: An editorial // Cureus. — 2024. — Vol. 16, № 5. — Article e61299. — https://doi.org/ 10.7759/cureus.61299.
12. Petreanu L., Mao T., Sternson S.M., Svoboda K. Development-dependent sequencing of corticospinal activity during mirror neuron-like action observation // Nature Neuroscience. — 2022. — Vol. 25, № 11. — P. 1491–1503. — https://doi.org/ 10.1038/s41593-022-01120-y.
13.Sadeghi S., Schmidt S.N.L., Mier D., Hass J. Effective connectivity of the human mirror neuron system during social cognition // Social Cognitive and Affective Neuroscience. — 2022. — Vol. 17, № 8. — P. 732–743. — https://doi.org/ 10.1093/scan/nsab138.
14. Mishra A, Englitz B, Cohen MX. EEG microstates as a continuous phenomenon. Neuroimage. 2020 Mar;208:116454. https://doi.org/ 10.1016/j.neuroimage.2019.116454
15. Milz P, Faber PL, Lehmann D, Koenig T, Kochi K, Pascual-Marqui RD. The functional significance of EEG microstates--As sociations with modalities of thinking. Neuroimage. 2016 Jan 15;125:643-656. https://doi.org/ 10.1016/j.neuroim age.2015.08.023
16. Gulyaev SA, Khanukhova LM, Garmash AA. Neurophysiological method for studying changes in the brain’s default mode network activity. Extreme Medicine. 2023; (2): 64–71. https://doi.org/10.47183/mes.2023.009
17. Gulyaev SA, Khanukhova LM, Garmash AA. Features of bioelectric activity of the retrosplenial cortex. Extreme Medicine. 2023; (3): 120–7. https://doi.org/10.47183/mes.2023.028
18. Jajcay N, Hlinka J. Towards a dynamical understanding of microstate analysis of M/EEG data. Neuroimage. 2023 Nov 1;281:120371. https://doi.org/ 10.1016/j.neuroimage.2023.120371. Epub 2023 Sep 15. PMID: 37716592.
19. Liu Q, Jia S, Tu N, Zhao T, Lyu Q, Liu Y, Song X, Wang S, Zhang W, Xiong F, Zhang H, Guo Y, Wang G. Open access EEG dataset of repeated measurements from a single subject for microstate analysis. Sci Data. 2024 Apr 13;11(1):379. https://doi.org/ 10.1038/s41597-024-03241-z. PMID: 38615072; PMCID: PMC11016104
20. Pascual-Marqui RD. The functional significance of EEG microstates--Associations with modalities of thinking. Neuroimage. 2016 Jan 15;125:643-656. https://doi.org/ 10.1016/j.neuroimage.2015.08.023
21. Murphy M, Wang J, Jiang C, Wang LA, Kozhemiako N, Wang Y; GRINS Consortium; Pan JQ, Purcell SM. A Potential Source of Bias in Group-Level EEG Microstate Analysis. Brain Topogr. 2024 Mar;37(2):232-242. https://doi.org/ 10.1007/s10548-023-00992-7. Epub 2023 Aug 7. PMID: 37548801; PMCID: PMC11144056.
22. Grech R, Cassar T, Muscat J, Camilleri KP, Fabri SG, Zervakis M, Xanthopoulos P, Sakkalis V, Vanrumste B. Review on solving the inverse problem in EEG source analysis. J Neuroeng Rehabil. 2008 Nov 7;5:25. https://doi.org/ 10.1186/1743-0003-5-25
23. Оценка когнитивного здоровья // Федеральныи центр мозга и неи ротехнологии . — URL: https://фцмн.рф/оценка-когнитивного-здоровья/#1723454084001-b256d758-2c15
24. Heyes C., Catmur C. What happened to mirror neurons? // Perspectives on Psychological Science. — 2022. — Vol. 17, № 1. — P. 153–168. — https://doi.org/ 10.1177/1745691621990638.
25. Iliadou P., Kladi A., Frantzidis C.A., Gilou S., Tepelena I., Gialaouzidis M., Papaliagkas V., Nigdelis V., Nday C.M., Kiosse oglou G., Papantoniou G., Bamidis P.D., Tsolaki M., Moraitou D. The pattern of mu rhythm modulation during emotional destination memory: Comparison between mild cognitive impairment patients and healthy controls // Journal of Alzheimer’s Disease. — 2019. — Vol. 70, № 2. — P. 559–571. — https://doi.org/ 10.3233/JAD-190311.
26. Inamoto T., Okazaki S., Nakamura J., Wada M. Motor-related mu/beta rhythm in older adults // Brain Sciences. — 2023. — Vol. 13, № 5. — Article 751. — https://doi.org/ 10.3390/brainsci13050751.
27. Koster M., Wurtz M., Langeloh M., Hoehl S. Down and up! Does the mu rhythm index a gating mechanism of the motor system during action observation? // Developmental Cognitive Neuroscience. — 2023. — Vol. 61. — Article 101255. — https://doi.org/ 10.1016/j.dcn.2023.101255.
28. Makino S., Kato T., Takehara D. Mu-ERD reflects action understanding, but the effect is small // Brain Research. — 2024. — Vol. 1794. — Article 148375. — https://doi.org/ 10.1016/j.brainres.2024.148375
29. Yang T., Bayless D.W., Wei Y., Landayan D., Marcelo I.M., Wang Y., DeNardo L.A., Luo L., Druckmann S., Shah N.M. Hypothalamic neurons that mirror aggression // Cell. — 2023. — Vol. 186, № 6. — P. 1195–1211. —https://doi.org/ 10.1016/j.cell.2023.01.022.
30. Haydock D, Kadir S, Leech R, Nehaniv CL, Antonova E. EEG microstate syntax analysis: A review of methodological challenges and advances. Neuroimage. 2025 Apr 1;309:121090. https://doi.org/ 10.1016/j.neuroimage.2025.121090. Epub 2025 Feb 16. PMID: 39961498; PMCID: PMC12043272.
31. Das S, Zomorrodi R, Enticott PG, Kirkovski M, Blumberger DM, Rajji TK, Desarkar P. Resting state electroencephalography microstates in autism spectrum disorder: A mini-review. Front Psychiatry. 2022 Dec 1;13:988939. https://doi.org/ 10.3389/fpsyt.2022.988939. PMID: 36532178; PMCID: PMC9752812.
32. Antonova E, Holding M, Suen HC, Sumich A, Maex R, & Nehaniv C (2022). EEG microstates: Functional significance and short-term test-retest reliability. Neuroimage: Reports, 2(2), 100089 https://doi.org/10.1016/j.ynirp.2022.100089.
This article licensed under the Creative Commons Attribution 4.0 International License CC-BY 4.0., which permits unrestricted use, distribution, and reproduction in any medium, provided the original author and source are properly credited.