
NL Journal of Agriculture and Biotechnology
(ISSN: 3048-9679)
Assessment of Avocado Producers Food Security Status – In Case of Wolaita and Kembata Tembaro Zones
Author(s) : Dr. Abera Abebe. DOI : 10.71168/NAB.02.04.121
Abstract
At the worldwide, regional, national, and local levels, there’s a direct correlation between food insecurity and poverty. The household’s security situation is at its most terrible level in rural Ethiopia. Due to various circumstances, ensuring food security in Ethiopia is becoming a significant concern. Therefore, the study aimed to identify determinants of food security status of avocado fruits producers in the study area. A simple random sampling technique was employed to take 385 sample household of avocado fruits producers. Both quantitative and qualitative types of data were collected. Primary data were collected through interview schedule, focus group discussion, and key informant interviews. Household Dietary Diversity Score (HDDS) was used to assess the household’s food security status and a binary logit model was employed to identify the determinants of food security status of a household. The result of the study exposed that 147(38.2%) and 238 (61.8%) of the households of the study area were food secure and insecure, use of household food insecurity access scale measurement. Access to extension service, sex of the household head, number of extension agent contact per months and quantity of avocado fruits produced were significant positively at 1% whereas family size and age were significant negatively at 1%. Hence, given that the majority of households experienced food insecurity, it is important to choose the right stakeholders to encourage household participation in various income-generating activities and to provide a timely and sufficient supply of agricultural technologies in order to improve the current food security situation. Keywords: Food Security, Determines, Avocado, Binary Logit, Wolaita Zone, KT zone.
Introduction
Agriculture is main economic pillars of the Ethiopian economy, and the overall economic growth of the country is highly dependent on the success of the agriculture sector [1]. Most rural communities in Ethiopia depend on agriculture [2] as the source of food and income [3]. Nevertheless, it is characterized as small scale with low productivity and vulnerable to weather and production-related shocks [4]. In 2019, the agricultural sector in Ethiopia contributed 33% of GDP and the sector remained the top-export earner for the country with close to 82% of all exports coming from it [5]. Other current food crises in Ethiopia are the failure to invest in sufficient local food production and the collapse of pastoral livelihoods. As a result, hunger and poverty are prevalent, which leads farmers to be chronically food insecure [2] and around 10 million chronically food-insecure people are targeted to PSNP [3]. Food security is crucial element for the long-term growth of communities, with a particular emphasis on rural areas. Without a doubt, “food security” is essential to society’s safety.
According to Anderson and Elisabeth [6], in the developing world like Ethiopia, different challenges face rural communities to be food secured like multifaceted variability of rainfall and temperature. Also According to Cochrane [7], during 2015/16, a large segment of the population in Ethiopia was vulnerable to drought as a result of food insecurity. To give remedy for food security problem, social protection program by the governmental and non-governmental organizations was implemented [8].
The one of the mechanisms to reduction of food waste in general and post-harvest losses in particular is considered as one of the mechanisms in ensuring food security mainly in developing countries especially following the 1974 first World Food Conference that identified reduction of post-harvest losses as part of the solution in addressing world hunger [9]. Not only the governmental and non-governmental organizations but also local communities tried to resolve the problem of food security through diversifying their assets, income, and activity [10]. However, the issue is still widespread in the nation, especially in the study area. As noted above, numerous empirical studies have been carried out in Ethiopia, but this study was started because there was a lack of specific information regarding the status of food security and the factors that determined food insecurity avocado fruits producers in the study area. Up order to fill in the gaps in knowledge on the state of food security and the variables affecting households in food-insecure areas, a study was conducted. Therefore, the study was to asses’ the food security status and its determinants of avocado fruits producers in the Wolaita and Kembata Tembaro Zones.
Data and Methods
1. Description of the Study Area
The study conducted in SNNPR of two zones, namely Wolaita and Kembata Tembaro Zones. Wolaita and Kembata Tembaro Zones are two adjacent zones among the 13 zones in the Southern Nations Nationalities and Peoples Regional (SNNPR) state of Ethiopia. Wolaita Sodo is an administrative center of the Wolaita Zone; Durame was the administrative center of Kembata Tembaro Zone. The Wolaita Zone has a total area of 4512 km2, administratively divided into 22 districts (locally termed woredas). Based on the 2007 Census conducted by the Central Statistical Agency this Zone has a total population of 2,473,190; with an area of 4,208.64 square km; whereas Kembata Tembaro Zone was subdivided into eight districts and five registered towns. Kembata Tembaro zone based on the 2007 Census conducted by the CSA, this Zone has a total population of 1,080,837, of whom 536,676 are men and 544,161 women: with an area of 1,355.89 square kilometers. This study was conducted in of the major avocado fruits producing area from wolaita zone; Damot Weyde and Sodo Zuriya distrcts, and from Kambata Tambero; Kacha Bira and Tembaro districts of SNNPR.
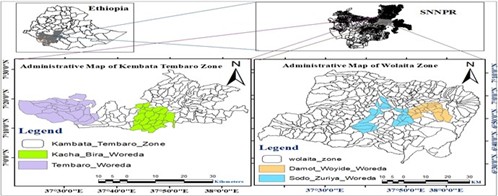 Figure 1. Location of the study area
2. Data Source and Sampling Procedure
Both primary and secondary data were used for this study. Primary data were collected from randomly selected avocado fruits producers from eight rural kebeles in the study area. Primary data were collected by structured and semi-structured questionnaires and by trained enumerators using Computer Aided Personal Interview. Secondary data was taken by reviewing secondary sources from published and unpublished documents of Central Statistical Authority, district agricultural and pq development office. In addition, journals and websites were visited to generate relevant secondary information focusing on the objectives of the study. Multi-stage sampling techniques were employed to select avocado fruits producers. In the first stage, four districts, namely Damot Weyde and Sodo Zuriya distracts from Wolaita Zones, and Kacha Bira and Tembaro districts from Kembata Tembaro zones were randomly selected from the avocado fruits producing distract of the two zone. In the second stage, a total of eight avocado fruits producing kebeles or districts were selected by using simple random sampling method from each of the four selected distracts. In the third stage, 385 farm households were randomly selected based on the probability proportional to their total size of numbers.
To obtain a representative sample size for cross-sectional household survey, the study employed the sample size determination formula given by [11].
![]()
Where n is the sample size, z is the inverse of the standard cumulative distribution that corresponds to the level of confidence, e is the desired level of precision, p is the estimated proportion of an attribute that is present in the population and q = 1-p. The value of z is found from statistical table which contains the area under the normal curve of 95% confidence level.
3. Methods of Data Analysis
1. Descriptive Statistical Analysis
Depending on the type of data at hand, the study employed both descriptive statistics and econometrics methods to analyze the determination food security status and its determinants of avocado fruits producers in the study area. Analyses of the data were carried out by using Statistical Packages for Social Sciences (SPSS version 20). Household dietary diversity scores and econometrics models were used to analyze the data collected. The type and quantity of food items consumed by the household for seven consecutive days were collected using weighed records method. Then it was converted to a kilocalorie and then divided to household size measured in adult equivalent (AE) and the number of days. Following this, the amount of energy utilized in kilocalories by the household was compared with the minimum subsistence requirement per adult per day (i.e. 2200 kcal).
2. Variables that Determine Households Food Security
Dependent Variable
Food security: Households‟ calorie intake or acquisition is the number of calories, or nutrients, available for consumption by household members over a defined period of time. Then the results would be compared with the minimum subsistence requirement per AE per day (i.e. 2200 kcal). Households who consume below this minimum requirement (2200 kcal per AE per day) were categorized as food insecure and those households who consume above the threshold were considered as food secure.
Household Food Security Status (HFINS): It is a dichotomous dependent variable in the model taking a value 1 if the household is food secure and 0 otherwise. Household’s food security status was determined by comparing total kilocalories consumed in household per adult equivalent per day with the daily minimum requirement of 2,200 kilocalories per adult equivalent per day. Households getting 2,200 Kcal/AE/seven day and above were considered as food secure and otherwise food insecure.
Independent Variables
It is hypothesized that a household food security at any time is influenced by the combined effects of a number of factors. The independent variables that are expected to have association with household food security were selected based on available literature. Any explanatory variable having negative coefficient was expected to reduce food security of the household whereas explanatory variable found to be positive were increased the food security of the households. Therefore, the major variables expected to have influence on the household food security were explained below:
Table 1: Description of variables hypothesized to influence food security status.
| Description of Variables | Measurement | Expected Sign |
| Sex of household head | Dummy (1 female, 0 male) | + |
| Age of household head | Continuous (years) | +/- |
| Education level | Continuous (year of schooling) | + |
| Family size | Continuous (Adult equivalent) | - |
| Landholding size | Continuous (ha) | + |
| Distance to market | Continuous (walking hour) | - |
| Quantity of avocado produced | Continuous (quintal) | + |
| Off/non-farm participation | Dummy (1=yes, 0=no) | + |
| Livestock ownership | Continuous (TLU) | + |
| Income from avocado sold | Continuous (ETB) | + |
Results and Discussion
1. Food Security Status Analysis
This section presents the measurement of food security status results and its determinants. In the first sub-section presented the descriptive result of food security measurement and the second sub-section covers the model results of factors affecting food security of smallholder farmers in the study areas.
1.1. Food Security Status of the Households
The households‟ food security status was measured by direct survey of consumption. Data on the available food for consumption, from home production, purchase and /or gift/credit/wage/salary in kind for the previous seven days before the survey day by the household was collected. Then the data were converted to kilocalories and then divided by household size measured in AE within seven days. Following this, the amount of energy in kilocalories available for the household is compared with the minimum subsistence requirement per adult per day (i.e. 2200 kcal).
The result from the sampled 385 respondents indicated that 147(38.2%) and 238 (61.8%) of the households of the study area were food secure and insecure, respectively. The maximum and minimum kilocalories consumed by a single adult in a day for food secure households were 2993.1880 and 2210.2200 kcals, and 2195.8460 and 1252.7730 kcals for food insecure households. The mean calorie intakes by food secure and food insecure sampled households were 2579.492136 kcals and 1634.234609 kcals. The difference is significant at 1% significance level. The standard deviations for food secure and food insecure households were to be 198.9860798 and 177.1163642 respectively (Table 2). The mean daily calorie intake per day per AE was 1995.15111kcal which is below the national average of daily requirement of 2200 kcal per day per adult equivalent for active and healthy life.
Table 2: Household food security status.
| Daily Energy Available per AE in (Kcal) | Food Secure (N=147) | Food Insecure (N=238) | Total Sample (N=385) | T-value |
| Maximum | 2993.1880 | 2195.8460 | 2993.188 | |
| Minimum | 2210.2200 | 1252.7730 | 1252.7730 | -35.607*** |
| Mean | 2579.492136 | 1634.234609 | 1995.15111 | |
| Slandered deviation | 198.9860798 | 177.1163642 | 495.846133 |
Source: Own computation results based on survey data, 2022. *** and *** show significance levels at 10%, 5% and 1%, respectively.
2. Demographic and Socio-economic Characteristics of Sample Households
The different characteristics of sample households in the study area were compared to see if there are significant differences between food secure and food insecure groups. These include, sex of the household head, age of the household head, household family size, educational level household, livestock holding, off/non-farm income, total amount of avocado fruits producing at given year, access to market information, total annual income from avocado fruits, dependency ratio, distance from market, access to credit and frequency of extension contact.
Table 3 showed that the discrete variables such as sex of household head, access to market information, access to extension contact, credit access and off-farm participation for sampled households.
The survey result indicated that 70.1% of male households were food secure and 89.5% of male households were also food insecure whereas 29.9 % of female households were foods secure and 10.5 % of female households were food insecure. The chi-square value for this variable showed that there was a significant difference between the two groups in terms of sex of the households. In addition, smallholder households who participated in off/non- farm activities showed that about 7.5% were food secure but 67.6% were food insecure. There was statistically significant proportion difference between food secure and food insecure households in terms of sex at 1% probability level. Moreover, about 92.5% sampled households who did not engage at any off/non-farm activities were food secured but 32.4 % were food insecure. The chi-square value also indicates that there was significant difference between the two groups in terms of off/non-farm activities.
There was statistically significant proportion difference between food secure and food insecure households in terms of farm income at 1% probability level. The table bellows shows that the result obtained regarding access to market information shows that about 63.9% were food secure but 61.3% were food insecure. In addition, about 36.1% sampled households who did not got market information access were food secured but 38.7 % were food insecure. The chi-square value also indicates that there was a significant difference between the two groups in terms of off/non-farm activities. There was statistically significant proportion difference between food secure and food insecure households in terms of access of market information at 5% probability level.
Table 3: Descriptive summary of dummy variables.
|
Variable |
Category |
Food Insecure (238) |
Food Secured (147) |
Total Sample (385) |
X2 |
|||
| No. | % | No. | % | no. | % | |||
| Sex of the Household Head | Male | 213 | 89.5 | 103 | 70.1 | 316 | 82.07 |
13.317*** |
| Female | 25 | 10.5 | 44 | 29.9 | 69 | 17.92 | ||
| Off -farm Income | Yes | 161 | 67.6 | 11 | 7.5 | 172 | 44.7 |
22.081*** |
| No | 77 | 32.4 | 136 | 92.5 | 213 | 55.3 | ||
| Access to Credit Service | Yes | 19 | 8 | 13 | 8.8 | 32 | 8.3 |
0.032 |
| No | 219 | 92 | 134 | 91.2 | 353 | 91.7 | ||
| Access to Extension Contact | Yes | 162 | 68.1 | 10 | 6.8 | 172 | 44.7 |
0.262 |
| No | 76 | 31.9 | 137 | 93.2 | 213 | 55.3 | ||
| Market Information | Yes | 146 | 61.3 | 94 | 63.9 | 240 | 623 |
8.995** |
| No | 92 | 38.7 | 53 | 36.1 | 145 | 37.7 | ||
Source: Own computation results based on survey data, 2022. *** and *** show significance levels at 10%, 5% and 1%, respectively.
The result of descriptive statistics shows that there exists a significant mean difference between foods secure and insecure households. Continuous variables including age of household head, educational level of household head, family size, dependence ratio, distance to market, livestock ownership (TLU), number of times extension contact per month and income from avocado fruits crops were significantly influence household food security status at various probability levels (Table 4).
The mean age of sample households was 45.95. Similarly, the mean age of food secure and insecure household heads was 42.46 and 48.11, respectively. The t-value shows that there is significant difference between the two groups associated with this variable at less than 1 % probability level. The mean family size including the household head for the sampled household was 7.86. The mean family size for food secured and insecure household was 6.8 and 8.5 respectively. The t-value result revealed that there is a significant family size difference between food secure and insecure households at 1% significant level (Table 4).
The mean educational level of the sampled household heads was 6.27 with a standard deviation of 2.66. The mean educational level of the household heads was 8.73 (SD=1.85) and 4.75 (SD=3.07) for food secure and food insecure households, respectively in the study area. The statistical test of the mean educational level of the household heads shows that there was statistically significant difference between food secure and food insecure households at 1% probability level (Table 4,2,6).
This showed that food secure households had achieved more grade level than food insecure households which may help them to reduce the risks of food insecurity. The distance to the central market is on average 3.07km. Table 4.26 indicates that the distance from the market for food secured households is 2.25km whereas for food insecure households are 3.58 km. The t-value result revealed that there is significant difference between food secure and insecure households with regard to the distance to central market at 5% significant level.
Average frequency of extension contact of the sampled households was 2.67 with a standard deviation of 0.784. The average frequency of extension contact was 3.16 with the standard deviation of 0.75 for food secure and 2.366 with the standard deviation of 0.804 for food insecure households, respectively. Therefore, the mean frequency of extension contact by food secure households was significantly higher than the food insecure. The difference was significant at 5% significance level (Table 4,2,3).
The mean dependency ratio of the sample households was 106.16 with the standard deviation of 77.85. The mean dependency ratio for food secure sampled households was 115.3 with the standard deviation of 70.86. For food insecure households, the mean dependency ratio was 100.53 with the standard deviation of 81.49. The mean dependency ratio of food insecure households was significantly higher than food secured households and the difference was significant at 1% significance level (Table 4,2,4).
The mean annual income got from avocado fruits of the sampled household heads was 5577.5Birr with a standard deviation of 3347.2. The mean annual income generated from avocado income from sampled household heads was 7505.9Birr (SD=3323.1) and 4386.5Birr (SD=2760.2) for food secure and food insecure households respectively. The statistical test of the mean annual income of the household heads shows that there was a statistically significant difference between food secure and food insecure households at 1% probability level (Table 4,2,4). This showed that food secure households had achieved more annual income from avocados fruits than food insecure households which may help them to reduce the risks of food insecurity. In addition to this livestock is a key resource in farm households where the farming households support their livelihood. From the survey result indicated that the sampled households have on average 3.04 livestock. Food secured and insecure households have on average 3.43 and 2.87 TLUs with a significance mean difference in relation to this variable (Table 4).
Table 4: Descriptive statistics of continuous variables.
|
Variables |
Food Insecure (238) | Food Secured (147) | Total Sample (385) | T-value | |||
| Mean | Std.err | Mean | Std.err | Mean | Std.err | ||
| Age of the Household Head | 48.11 | 6.774 | 42.46 | 4.998 | 45.95 | 6.74 | -76.7*** |
| Education Level HH | 4.75 | 3.017 | 8.73 | 1.85 | 6.27 | 3.266 | -38.5*** |
| Family Size HH | 8.5 | 1.269 | 6.8 | 1.13 | 7.86 | 1.466 | 76.2*** |
| Dependence Ration | 100.53 | 81.494 | 115.3 | 70.86 | 106.16 | 77.85 | 26.6*** |
| TLU | 2.87 | 1.1355 | 3.43 | 1.54 | 3.804 | 1.334 | 40.0*** |
| Income from Avocado (Birr) | 4386.5 | 2760.2 | 7505.9 | 3323.1 | 5577.5 | 3347.2 | -22.2*** |
| Extension Contact Month | 2.366 | .804 | 3.16 | 0.75 | 2.67 | 0.874 | -14.2** |
| Distance to nearest MKT | 3.58 | 1.249 | 2.25 | 1.047 | 3.07 | 1.34 | 12.8** |
Source: Own computation results based on survey data, 2022. *** and *** show significance levels at 10%, 5% and 1%, respectively.
3. Determinants of Household Food Security Status
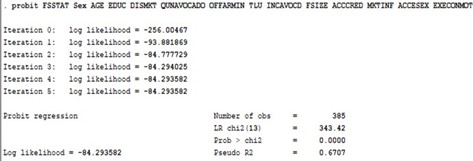
Estimates of the parameters of the variables expected to determine the households‟ food security status were presented in Table 5. The goodness-of-fit was tested by the Log likelihood ratio (LR) test. The result showed that the chi-square value was 343.42 and the pro>chi2 was 0.000; this means thatX2is statistically significant and the model displays a good fit. The Pseudo of the model is also 0.68, implying that 68% of the variation in the model was explained by the independent variables. This verifies that the model has a good fit to the data and explained significant non-zero variations in factors influencing households‟ food security status.
Probity regression model was used to identify the determinants of households‟ food security status in the study area. Accordingly, variables hypothesized to have influence on the household’s food security status were fitted in the model. Therefore, out of 13 variables included in the model, nine (7) variables were statistically significant. Namely, sex of household head, age of the household age, distance to nearest, household size, quaintly of avocado fruits produced, access to extension contact and frequency of extension contacts within the month.
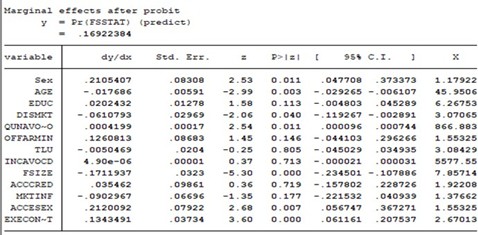
Sex of Household Heads: It had significant and positive relationship with the household food security status. It was significant at one percent probability level. The result showed that male headed households were more food secure than female headed households. Other factors remaining constant, food security of male household headed increased by 21 percent than female headed households. The possible explanation was the differential access to production resources where male had more access to production resources like cultivated land than females. This result similar with the result of had done with by [11].
Age of Household Head: It had significant and negative relationship with the household food security status. It was significant at 1% probability level. The results explained that household head affected food security negatively. If age of a person gets older, the ability and strength of the person gets weaker so that there is more probability of that household to be food insecure. If the age of the household increased by one year the probabilities of food securities decreased by 1.7%. This result similar with Indris [12] found out that age of household head affected food insecurity positively.
Distance to Market Center: It has been found to be negatively related with food security and significant at less than 5% probability level. It was expected that households nearer to market centers had better chances to be food secure than those who are away from market centers due to the reason that households nearer to market center have the probability of selling their produce and purchasing food from market. As distance from market center becomes far and far the probability of households to sell their product and purchase supplementary materials becomes less which resulted in low probability of household being food secure. If market centers increased by 1km the food security decreases by 24%. The result of this study is similar with study findings of [13].
Quantities of Avocado Fruits: This was found to have a significant influence and positive relationship with household food security at 1% probability level which implies that the likelihood of food security increases with producing avocado fruits. Amount of avocado production is positively and strongly associated with higher income, higher rate and intensity of use of purchased other goddess and services and higher yield and hence improved food security status of households. Therefore, those households who produce more amount of avocado fruits crops become in a better position for food security than those who didn`t produce avocado crops. Holding other things constant, if avocado production at household level increased by 1kg food security increases by a12.6%. This study result resembles the study by [14].
Family Size: This is measured in adult equivalent and influenced food security of the household negatively and significantly at 1% significance level. This might be, households in rural areas with large family size mainly composed of nonproductive members could face difficulty in ensuring food security due to high burden levied on active labor and less food availability to each person within the household and ultimately end up with difficulty in achieving food security. This implies larger household sizes require increased food expenditure and competition for limited resources. The survey result indicated that as family size increases by one person, the probability of household to be food secure decreases by 17.1%. This result resembles with the findings of [15].
Access to Extension Services: As hypothesized, it was positively related with food security and statically significant at less than 1% probability level. This is because farm households who have the opportunity of accessing extension services would build their capacity to generating knowledge and the better the market information the farmers have about the products‟ marketing; the more output would be sold. If extension services access increased by one unit, other things are constants food security increased by 84%.
Frequency of the number of extension contacts: It had a significant and positive relationship with household food security at 1% probability level. This implies that the probability of food being secured households increases with access to frequency of extension contact. The marginal effect result show that, as compared to household who did not access to frequency of extension contact, the probability of the access to frequency of extension contact household’s to become food secure was higher by 113.4%. More frequent extension contact enhances households‟ access to better avocado crop production techniques, improved input as well as other production incentives, and this helps to improve food energy intake status of households (Table 4,2,6). This finding is in line with the result of [16].
Table 5: Determinants of food security status of the household.
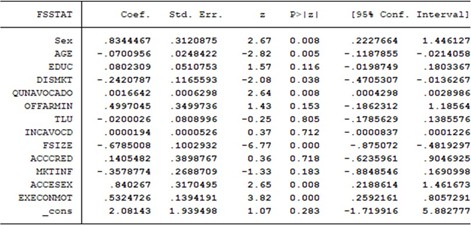
Source: Own computation results based on survey data, 2022.*** and *** show significance levels at 10%, 5% and 1%, respectively
Conclusion and Recommendation
Conclusion
The capacity of communities to handle the problem of food insecurity is decreasing every day. The result of the study exposed that 147(38.2%) and 238 (61.8%) of the households of the study area were food secure and insecure, use of household food insecurity access scale measurement. According to the Household Dietary Diversity Score (HDDS) results, the majority of sample respondents experienced are food insecurity. The food insecure households were unable to buy the food they needed on a daily basis with the money they made from their main subsistence farming and non-farming activities. Food security strategies that boost food availability, food access, and fortify emergency responses should be developed since the majority of households lacked adequate food security. Various socioeconomic factors influenced the household’s level of food security. These socioeconomic characteristics were found using the binary logit model. They were affecting the food security status of the household either positively such as, Sex of the house hold, quantity of avocado produced in quintals, access to extension contact, and number extension agent contact per months of number of days or negatively such as, age of the household head, distance to market in kilo meter, and family size) at different significance levels. Households with aged, large family size, and away from market centers household heads are more likely to be food insecure than those with young aged, smaller family size and nearest to market from residential household heads. Overall, household-related factors that affect personal production, stocks, and household purchasing power of food in the research area influence household food insecurity.
Recommendation
- Improve the access to road and control over strategic resources like land, livestock, cash crops, and other household possessions
- Increasing awareness to the point where it has an impact on family planning in rural
- It was reasonable to strengthen inter-resettlement initiatives in order to improve food security by allocating sufficient amounts of agricultural land and other natural resources for food production and other forms of income.
- Encourage the private sector to expand employment prospects in agriculture, industry, handicraft, and business to create more jobs, especially in rural areas.
References
1. FAO. (2014). Food and Agriculture Organization Ethiopia country programming framework. Office of the FAO Representative in Ethiopia to AU and ECA Addis Ababa, 2016
2. FAO. (2015). The state of food and agriculture social protection and agriculture: Breaking the cycle of rural poverty. Food and agriculture organization of the United Nations (pp. 1–151). Governance and Social Development Resource Centre. https://www.eldis.org/ organisation/A6247.
3. FSIN. (2017). Global report on food crises.Gujarati, D. (1995). Basic Econometrics. Second Ed. MacGraw Hill, Inc.
4. Bezabih, M., Mannberg, A., & Siba, E. (2014).The land certification program and off-farm employment in Ethiopia. Environment for Development Discussion Paper Series; EfD DP 14-22.
5. Ethiopian Economics Association (EEA). (2021). State of Ethiopian Economy: Economic development, population dynamics, and welfare; February 2021.
6. Anderson, S., & Elisabeth, F. (2015). USAID office of food for peace food security country framework for Ethiopia FY 2016–FY 2020. Food Economy Group.
7. Cochrane, L. (2017). Strengthening food security in rural Ethiopia. Doctoral Dissertation (Interdisciplinary Studies) submitted to the. University of British Columbia
8. MoA. (2014).Disaster risk management and food security sector food security coordination directorate. Retrieved http://www.dppc.gov.et
9. Parfitt J., Barthel M., Macnaughton S. 2010. Food waste within food supply chains: quantification and po-tential for change to 2050. Philosophical Transac-tions of the Royal Society Biological Sciences 365(1554): 3065–3081.DOI: 10.1098/rstb.2010.0126.
10. Ellis, F. (2000). Rural livelihoods and diversity in developing countries. Oxford University Press.
11. Kothari, C. (2004). Research methodology, methods, and techniques (2 nd ed.). New Age International (P) LimitedPublishers.
12. Greenwell, C.M. and Pius, C. 2012. „Estimating Effects of Constraints on Food Security in Malawi: Policy Lessons from Regressions Quantiles‟, Applied econometrics and International Development 12(2).
13. Indris Siraje. 2012. Assessment of food insecurity, its determinants and coping mechanisms among pastoral house holds of Afar National Regional State, the case of Chifra district. An MSc thesis presented to the School of GraduateStudies of Haramaya University.
14. Abayineh Amare and Belay Simane, 2017. Assessment of household food security in the face of climate change and variability in the upper Blue-Nile of Ethiopia. Journal of Agricultural Science and Technology, 7: 285-300.
15. Sisay Debebe, 2012. Agricultural Technology Adoption, Crop Diversification and Efficiency of Maize-Dominated Small holder Farming System in Jimma Zone, South-Western Ethiopia. A Dissertation Submitted to Postgraduate Program Directorate of Haramaya University.
16. Hussein, W. and Janekarnki, P. 2013. Determinants of rural household food security in Jigjiga district of Ethiopia. Kasetsart Journal of Social Science, 84: 171-180.
This article licensed under the Creative Commons Attribution 4.0 International License CC-BY 4.0., which permits unrestricted use, distribution, and reproduction in any medium, provided the original author and source are properly credited.